
In this article, I discover the Prometheus Operator and how I can use it to monitor my Gitea deployment and my Postgres StatefulSet.
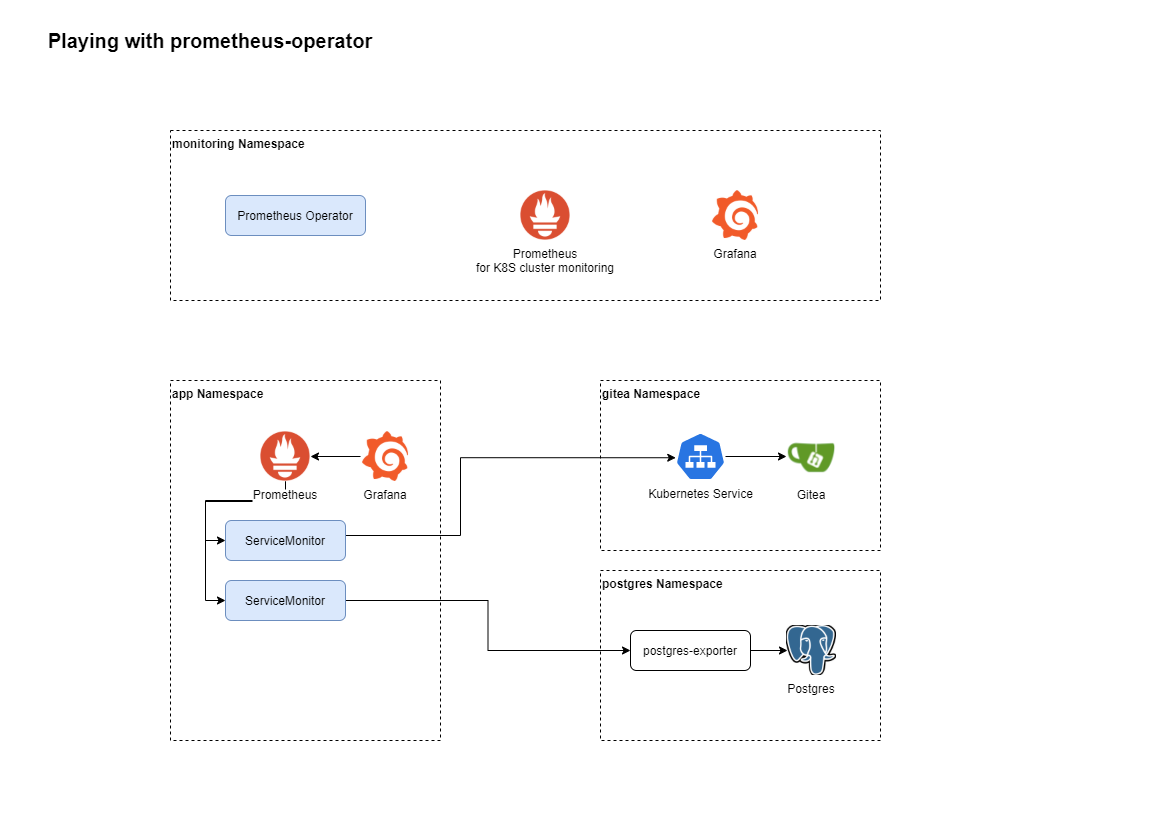
The idea is to deploy the use case shown in the diagram above.
I create a new app Namespace in which I will define a ServiceAccount, a Prometheus resource and some ServiceMonitors targetting application pods running in other namespaces.
This is a quite complex deployment but it is only meant for testing purpose.
Adding a Prometheus instance
Create a Namespace named app.
kubectl create namespace appCreate a ServiceAccount prometheus-app-sa
apiVersion: v1
kind: ServiceAccount
metadata:
  name: prometheus-app-sa
Create a ClusterRoleBinding to assign the ClusterRole prometheus-kube-prometheus-prometheus that is created during the kube-prometheus-stack installation to the new ServiceAccount prometheus-app-sa.
apiVersion: rbac.authorization.k8s.io/v1beta1
kind: ClusterRoleBinding
metadata:
  name: prometheus-app
roleRef:
  apiGroup: rbac.authorization.k8s.io
  kind: ClusterRole
  name: prometheus-kube-prometheus-prometheus
subjects:
- kind: ServiceAccount
  name: prometheus-app-sa
  namespace: app
Create a new prometheus resource using the following YAML file.
apiVersion: monitoring.coreos.com/v1
kind: Prometheus
metadata:
  labels:
    app: prometheus-app
  name: prometheus-app
  namespace: app
spec:
  replicas: 1
  retention: 2d
  serviceAccountName: prometheus-app-sa
  serviceMonitorSelector:
    matchLabels:
      env: app
Check that a Prometheus pod has been started.
kubectl get pods -n app
NAME READY STATUS RESTARTS AGE
prometheus-prometheus-app-0 2/2 Running 1 83s
# Create a port-forward to reach the prometheus ui
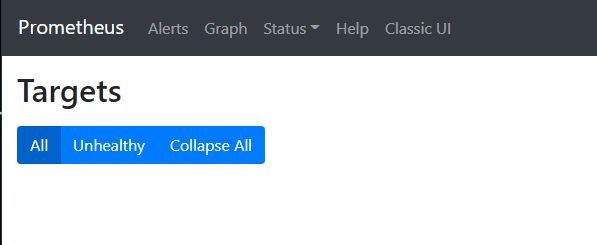
kubectl port-forward prometheus-prometheus-app-0 9090 -n appOpen a web browser and navigate to http://localhost:9090 -> Status -> Targets
Configure scraping of Gitea metrics
Create a ServiceMonitor that will scrape metrics from the Gitea service (as Gitea exposes Prometheus metrics through its http port on /metrics).
apiVersion: monitoring.coreos.com/v1
kind: ServiceMonitor
metadata:
name: gitea-sm
labels:
env: production
spec:
selector:
matchLabels:
app: gitea
namespaceSelector:
matchNames:
- gitea
endpoints:
- port: http
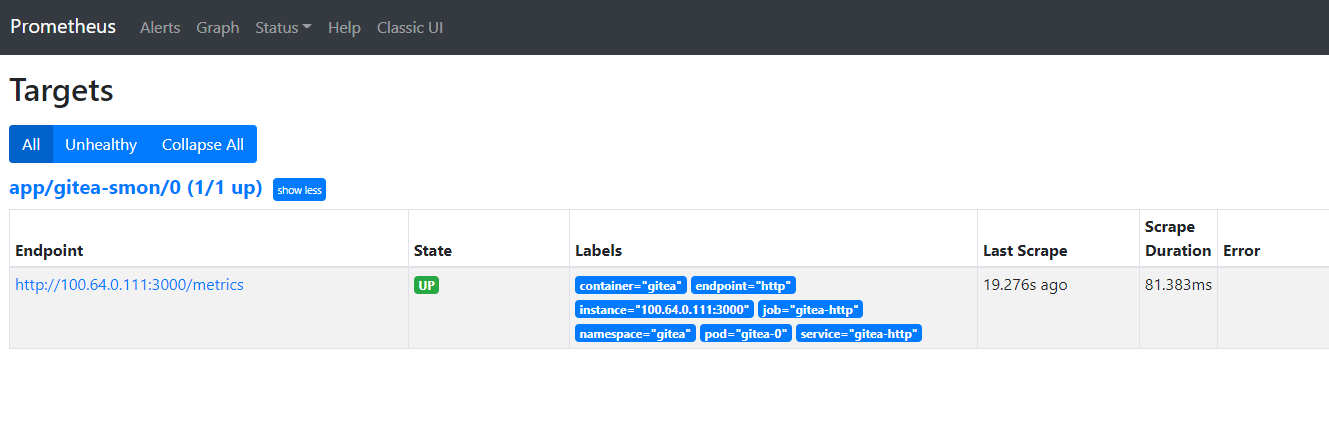
path: /metricsAfter a few seconds, refresh the Status -> Targets page and the new Gitea service target should appear.
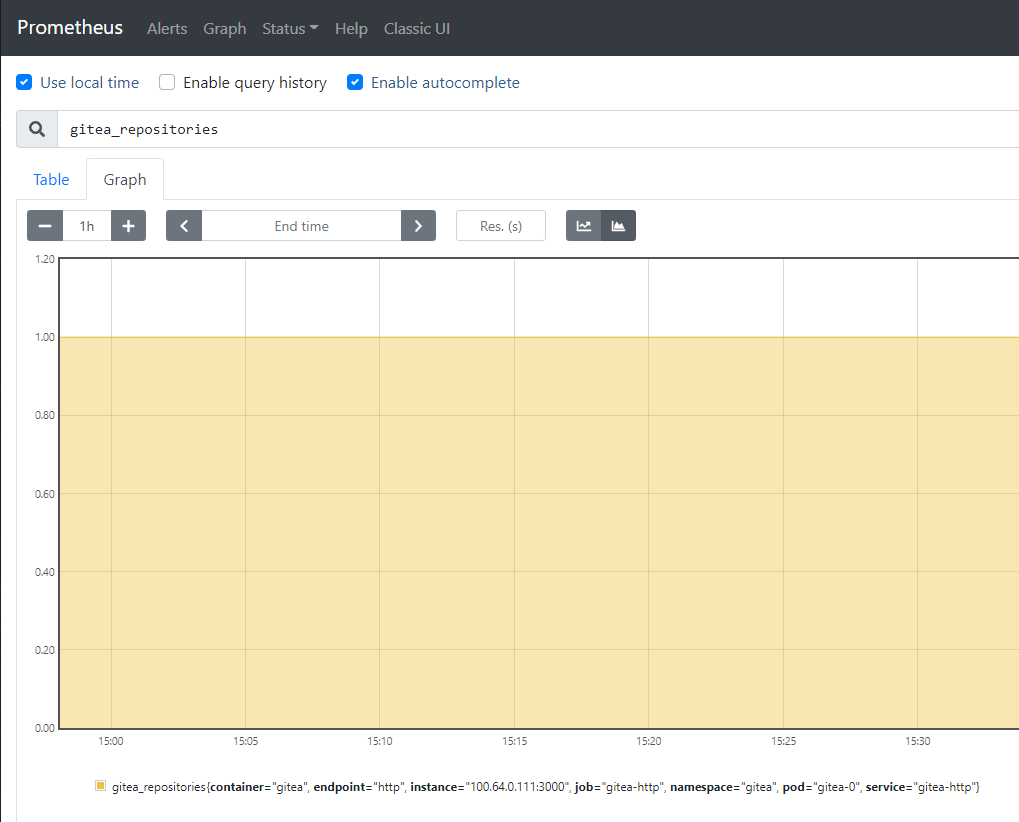
We can also see that some gitea_* metrics are available for query.
Configure scraping of Postgres metrics
Unlike Gitea, Postgres does not expose natively a /metrics endpoint with metrics scrapeable by Prometheus.
Fortunately, there exists an exporter whose purpose is to expose Postgres metrics for Prometheus.
Exporters can be cumbersome to deploy and most of the time they are packaged as Helm charts. You can find them in the prometheus-community/helm-charts repository on Github.
First create a Secret postgres-exporter-secrets that will contain a key dbconn containing the connection string to the Postgres instance using the format postgresql://user:password@server:5432/?sslmode=disable.
kubectl create secret generic postgres-exporter-secret \
  --from-literal=dbconn='postgresql://user:password@server:5432/?sslmode=disable' \
  -n postgres
Then create a file postgres-exporter-values.yaml with the following content:
service:
  labels:
    app: postgres-exporter

config:
  datasourceSecret:
      name: postgres-exporter-secret
      key: dbconn
  autoDiscoverDatabases: true
Add a label app=postgres-exporter to the service. Use that as selector to configure a ServiceMonitor.
Specify the key dbconn of Secret postgres-exporter-secret as data source where the exporter should connect to and configure the option for automatic database discovery.
Install the Helm chart with the custom values in the postgres namespace.
helm upgrade --install prometheus-postgres-exporter prometheus-community/prometheus-postgres-exporter -f postgres-exporter-values.yaml -n postgresCheck that the metrics are exposed by setting up a port-forward and connecting through a web browser.
kubectl get pods -n postgres

NAME                                            READY   STATUS    RESTARTS   AGE
postgres-sfs-0                                  1/1     Running   0          17d
prometheus-postgres-exporter-6cf9485949-nmwx7   1/1     Running   0          3h24m

# Create a port-forward to reach the prometheus ui
kubectl port-forward prometheus-postgres-exporter-6cf9485949-nmwx7 9187 -n postgres
Browse to http://localhost:9187/metrics and you should be able to see the metrics exposed by the exporter.
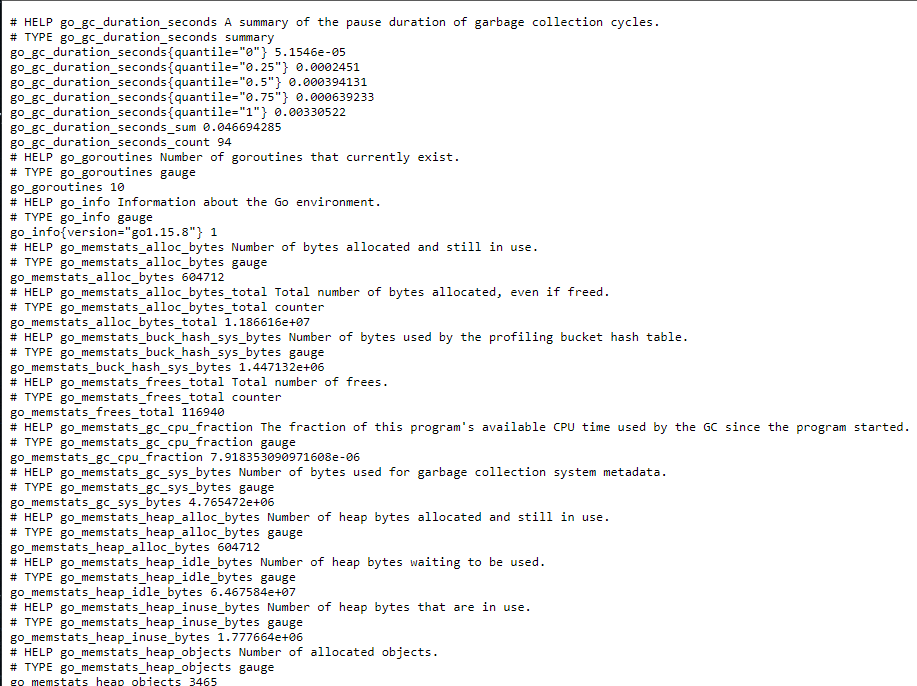
Now create a ServiceMonitor to scrape the metrics exposed by the postgres-exporter.
apiVersion: monitoring.coreos.com/v1
kind: ServiceMonitor
metadata:
name: postgres-sm
labels:
env: app
spec:
selector:
matchLabels:
app: postgres-exporter
namespaceSelector:
matchNames:
- postgres
endpoints:
- port: http
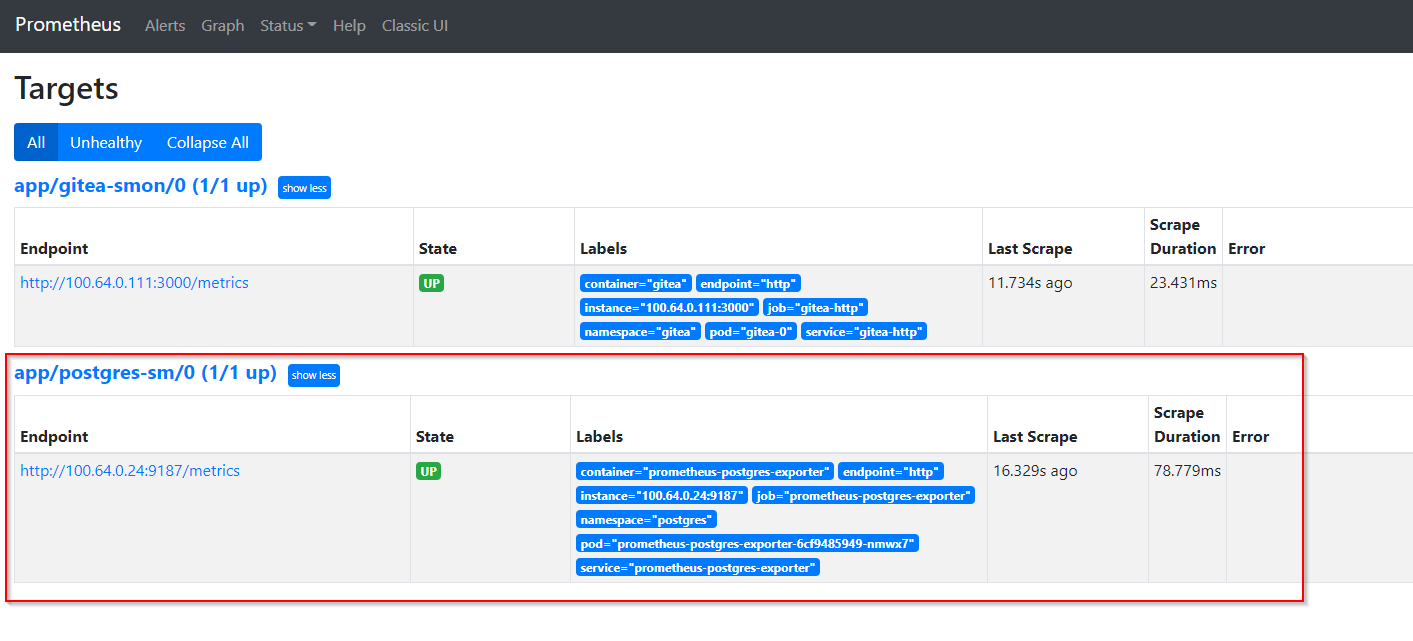
path: /metricsAfter a few seconds, the new scrape target appears in Prometheus UI.
Visualize metrics with Grafana
All metrics are configured and scraped by the new Prometheus instance. Use Grafana to visualize these metrics.
Deploy a new Grafana instance in the app Namespace.
# Add Grafana Helm charts repository
helm repo add grafana https://grafana.github.io/helm-charts

# Update the Helm repositories
helm repo update

# Deploy Grafana
helm upgrade --install grafana-app grafana/grafana -n app
Warning : this is a very basic Grafana deployment without persistance of the data because it is only a test. Don’t forget to add a Persistant Volume if you want to keep your data through pod restarts!
Login to the Grafana instance in app namespace.
Configure the Prometheus in app namespace as default data source.
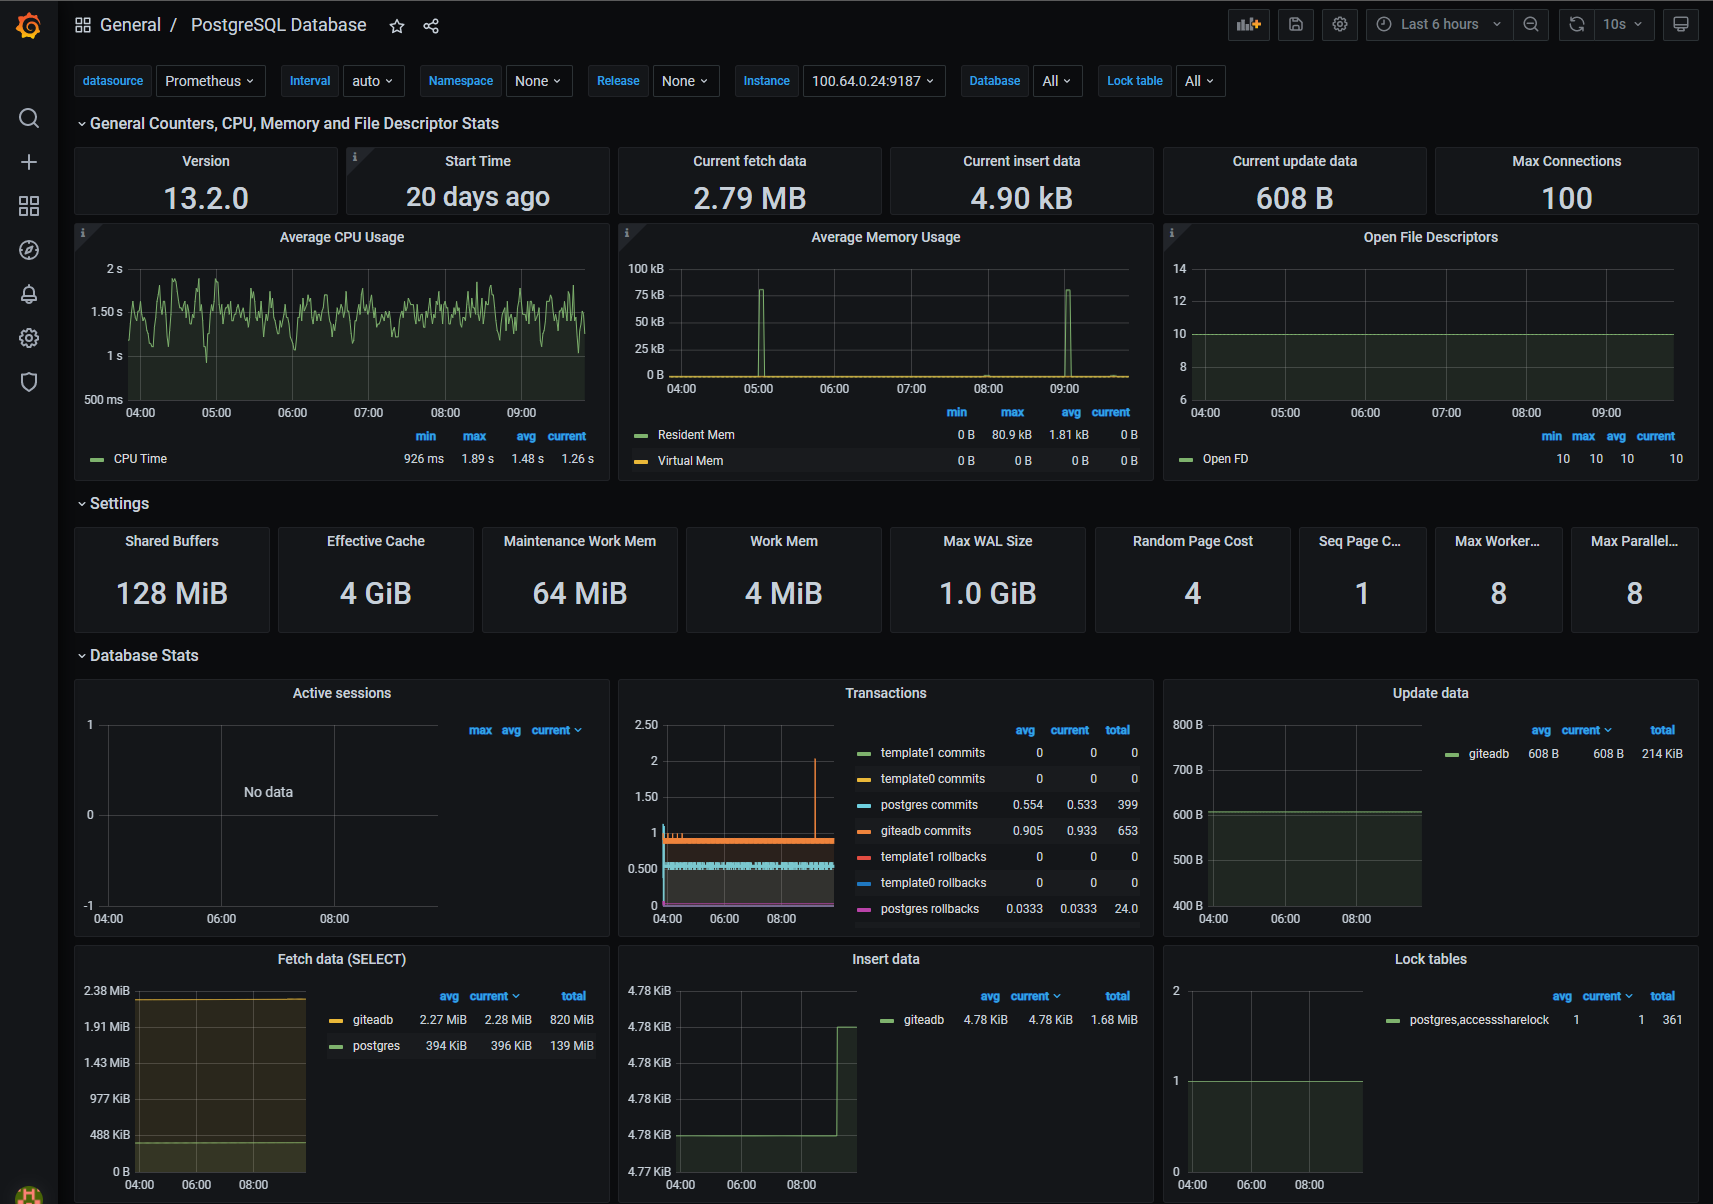
Import some Postgres / Gitea dashboards and enjoy the nice metrics!
Conclusion
The Prometheus Operator enables the deployment of additional Prometheus instances by applying some YAML files. Those deployments follow a well established scheme and thus standardize the management of multiple Prometheus instances.
I did only scratch the surface though because I could have also played with additional rules or AlertManager but hey, you get the idea.
Next time I will explore a new option when you want to scrape metrics and store them in an external Prometheus storage like Amazon Managed Prometheus without deploying additional Prometheus instances in your Kubernetes cluster. Stay tuned !