Introduction
When running workloads in a Kubernetes cluster, a crucial aspect of the production operations is monitoring. Support engineers need to have access to metrics / logs to diagnose and solve problems. Alerting must also be enabled to not rely only on reactive care.
When it comes to monitor an Azure Kubernetes Service managed cluster, the monitoring of the platform can be enabled very simply by deploying the containerized OMS agent as a daemonset. See the documentation for more info on how to enable monitoring in your AKS cluster (or even ARC enabled clusters …)
Now, this is not enough. Operations teams (and development teams) often needs metrics from the applications and the de-facto standard that is currently promoted by Cloud Native Computing Foundation to gather application metrics is Prometheus. Many components / applications running inside a Kubernetes cluster will expose their metrics via an endpoint compatible with Prometheus scraping. If this is not the case (legacy applications), you can rely on exporters to bring that functionality.
Scraping metrics from exporters and storing them for query require the deployment of a Prometheus instance (at least one). Managing one instance scraping metrics from a few dozens of endpoints is easy, but when you want to scale that to hundreds of services running on dozens (hundreds?) of nodes, Prometheus can become a challenge.
In an earlier article on this blog, we explored the use of Amazon Managed Prometheus service to dump metrics collected on a local Prometheus instance to a central storage that avoids us scalability issues.
Today we will explore another solution : use the Log Analytics agent to scrape Prometheus compatible endpoints and store metrics into Logs. Yes, you read it well, no need to install a Prometheus instance today!
Prerequisites
- a valid Azure subscription
- an AKS cluster with monitoring option enabled
The solution
First, a diagram of the solution.
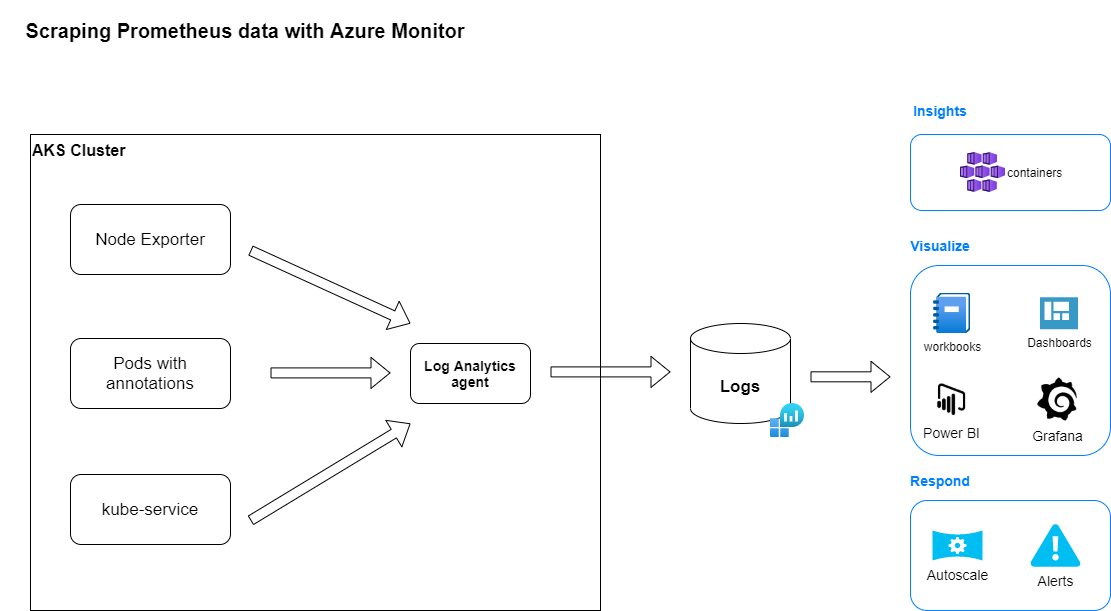
The Log Analytics agent container deployed in the AKS cluster will scrape data in 3 different configurations and send them to a Log analytics workspace. These data will be available to all tools / services running or interfacing with Azure Monitor.
Configuration
Once Azure Monitor is enabled in your cluster (or the Log Analytics agent container is deployed), configuring the scraping of Prometheus endpoints occurs through the setup of a ConfigMap for the Log Analytics agent.
The base ConfigMap YAML deployment is available from Github.
There are 3 ways to configure data collection:
- using pod annotation (cluster-wide)
- specifying an array of Kubernetes service (cluster-wide)
- specifying an array of URLs (per node and/or cluster-wide)
In this article, we will implement the pod annotation as you just need to add some annotations to your pods to automatically have the Log Analytics agent collecting metrics from them.
To configure this, edit the base ConfigMap [prometheus_data_collection_settings.cluster] section
prometheus-data-collection-settings: |-
    # Custom Prometheus metrics data collection settings
    [prometheus_data_collection_settings.cluster]
        # Cluster level scrape endpoint(s). These metrics will be scraped from agent's Replicaset (singleton)
        # Any errors related to prometheus scraping can be found in the KubeMonAgentEvents table in the Log Analytics workspace that the cluster is sending data to.

        #Interval specifying how often to scrape for metrics. This is duration of time and can be specified for supporting settings by combining an integer value and time unit as a string value. Valid time units are ns, us (or µs), ms, s, m, h.
        interval = "1m"

        ## Uncomment the following settings with valid string arrays for prometheus scraping
        #fieldpass = ["metric_to_pass1", "metric_to_pass12"]

        #fielddrop = ["metric_to_drop"]

        # An array of urls to scrape metrics from.
        # urls = ["http://myurl:9101/metrics"]

        # An array of Kubernetes services to scrape metrics from.
        # kubernetes_services = ["http://my-service-dns.my-namespace:9102/metrics"]

        # When monitor_kubernetes_pods = true, replicaset will scrape Kubernetes pods for the following prometheus annotations:
        # - prometheus.io/scrape: Enable scraping for this pod
        # - prometheus.io/scheme: If the metrics endpoint is secured then you will need to
        #     set this to `https` & most likely set the tls config.
        # - prometheus.io/path: If the metrics path is not /metrics, define it with this annotation.
        # - prometheus.io/port: If port is not 9102 use this annotation
        monitor_kubernetes_pods = true

        ## Restricts Kubernetes monitoring to namespaces for pods that have annotations set and are scraped using the monitor_kubernetes_pods setting.
        ## This will take effect when monitor_kubernetes_pods is set to true
        ##   ex: monitor_kubernetes_pods_namespaces = ["default1", "default2", "default3"]
        # monitor_kubernetes_pods_namespaces = ["default1"]

        ## Label selector to target pods which have the specified label
        ## This will take effect when monitor_kubernetes_pods is set to true
        ## Reference the docs at https://kubernetes.io/docs/concepts/overview/working-with-objects/labels/#label-selectors
        # kubernetes_label_selector = "env=dev,app=nginx"

        ## Field selector to target pods which have the specified field
        ## This will take effect when monitor_kubernetes_pods is set to true
        ## Reference the docs at https://kubernetes.io/docs/concepts/overview/working-with-objects/field-selectors/
        ## eg. To scrape pods on a specific node
        # kubernetes_field_selector = "spec.nodeName=$HOSTNAME"
Apply the ConfigMap YAML manifest.
kubectl apply -f <name of the YAML deployment file>All the Log Analytics agent pods will be restarted in a rolling fashion. You can check the good deployment by inspecting the logs of the Log Analytics agent pods.
# Get the name of the OMS agent pods
kubectl get pods -n kube-system

# Check the logs of the OMS agent pods
kubectl logs <name of agent pod> -n kube-system
Test
We will deploy a simple Prometheus test application. This is a small Golang application exposing a /metrics endpoint. All requests to / return 200 response code. All requests to /err return 404 response code.
Create a deployment YAML file for this application and apply it.
apiVersion: apps/v1
kind: Deployment
metadata:
  labels:
    app.kubernetes.io/name: prometheus-example-app
  name: prometheus-example-app
spec:
  replicas: 1
  selector:
    matchLabels:
      app.kubernetes.io/name: prometheus-example-app
  template:
    metadata:
      annotations:
        prometheus.io/scrape: "true"
        prometheus.io/port: "8080"
      labels:
        app.kubernetes.io/name: prometheus-example-app
    spec:
      containers:
      - name: prometheus-example-app
        image: quay.io/brancz/prometheus-example-app:v0.3.0
        ports:
        - name: web
          containerPort: 8080
When deployment is done, configure port-forwarding to the pod and run some requests to / and /err.
Note: we use port-forwarding to avoid costs related to the exposition of a service outside of the Kubernetes cluster.
Example of /metrics
# HELP http_request_duration_seconds Duration of all HTTP requests
# TYPE http_request_duration_seconds histogram
http_request_duration_seconds_bucket{code="200",handler="found",method="get",le="0.005"} 2
http_request_duration_seconds_bucket{code="200",handler="found",method="get",le="0.01"} 2
http_request_duration_seconds_bucket{code="200",handler="found",method="get",le="0.025"} 2
http_request_duration_seconds_bucket{code="200",handler="found",method="get",le="0.05"} 2
http_request_duration_seconds_bucket{code="200",handler="found",method="get",le="0.1"} 2
http_request_duration_seconds_bucket{code="200",handler="found",method="get",le="0.25"} 2
http_request_duration_seconds_bucket{code="200",handler="found",method="get",le="0.5"} 2
http_request_duration_seconds_bucket{code="200",handler="found",method="get",le="1"} 2
http_request_duration_seconds_bucket{code="200",handler="found",method="get",le="2.5"} 2
http_request_duration_seconds_bucket{code="200",handler="found",method="get",le="5"} 2
http_request_duration_seconds_bucket{code="200",handler="found",method="get",le="10"} 2
http_request_duration_seconds_bucket{code="200",handler="found",method="get",le="+Inf"} 2
http_request_duration_seconds_sum{code="200",handler="found",method="get"} 6.5601e-05
http_request_duration_seconds_count{code="200",handler="found",method="get"} 2
# HELP http_requests_total Count of all HTTP requests
# TYPE http_requests_total counter
http_requests_total{code="200",method="get"} 2
http_requests_total{code="404",method="get"} 1
# HELP version Version information about this binary
# TYPE version gauge
version{version="v0.3.0"} 1
Check if data are collected and sent to Azure Monitor. In the Azure Portal, go to your AKS cluster then select Monitoring -> Logs.
This will bring you to the Azure Log Analytics workspace explorer where you can type your Kusto Query Language queries. Run the following KQL to retrieve a count summary of the metrics collected.
InsightsMetrics
| where Namespace == "prometheus"
| extend tags=parse_json(Tags)
| summarize count() by Name
The metrics exposed by our sample applications are available in the Log Analytics workspace.
Check the structure of the data by running the following query.
InsightsMetrics
| where Namespace == "prometheus"
| where Name == "http_requests_total"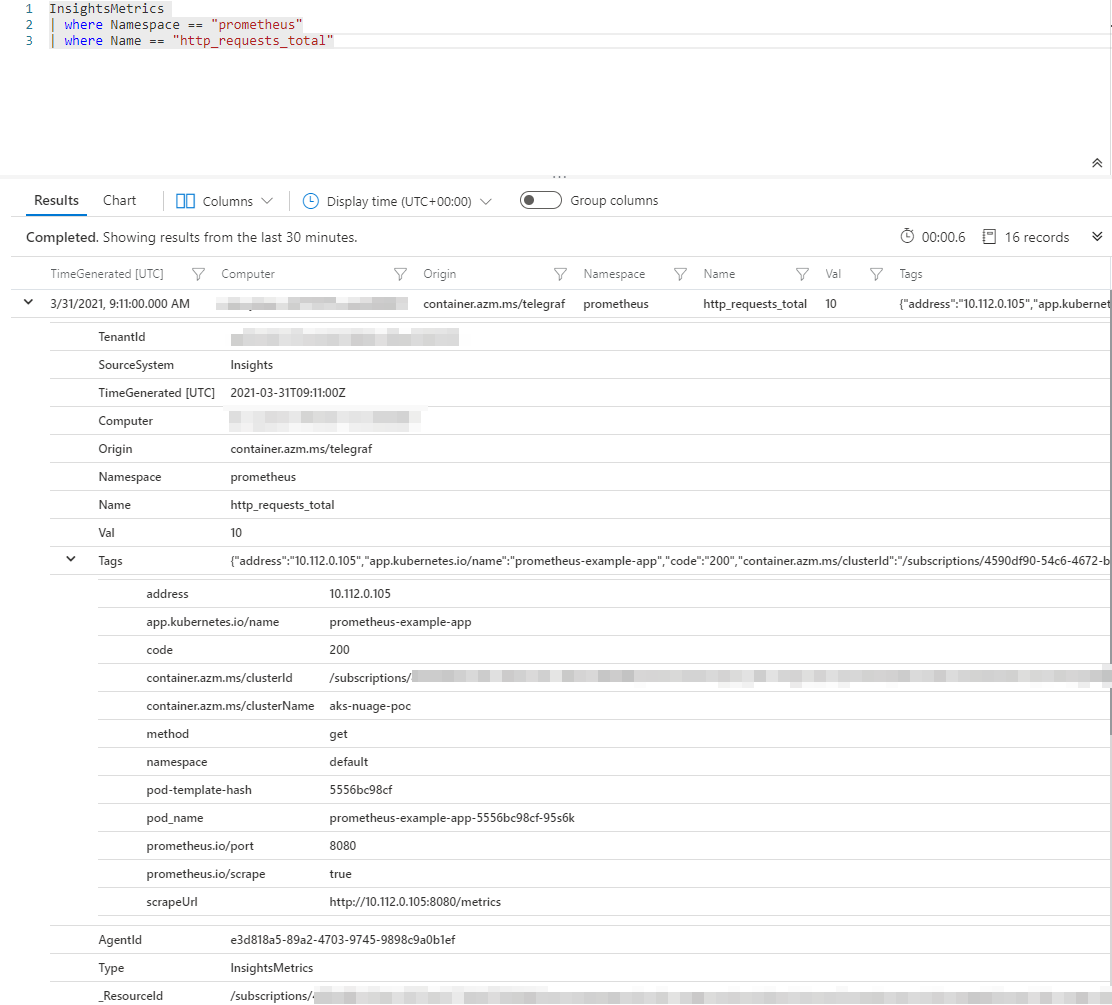
Compare that with the output of the /metrics endpoint for the same metric.
http_requests_total{code="200",method="get"} 2
http_requests_total{code="404",method="get"} 1- Namespace is always
prometheus. - Name contains the metric name.
- Val contains the value collected.
- Tags is a json object containing many info like the labels applied to the Prometheus metric. This is the column to use to filter on metric labels.
Let’s take an example. We want to graph the evolution of the number of good (200) versus bad (404) requests made to the application.
To be able to get the result of that query, we’ll need to summarize the max(Val) by the code values present in Tags field and by 1 minute (using KQL bin scalar function) .
InsightsMetrics
| where Namespace == "prometheus"
| where Name == "http_requests_total"
| summarize max(Val) by tostring(parse_json(Tags).code), bin (TimeGenerated, 1m)
| order by TimeGenerated asc
Switch from Results to Chart view and select Line Chart style.
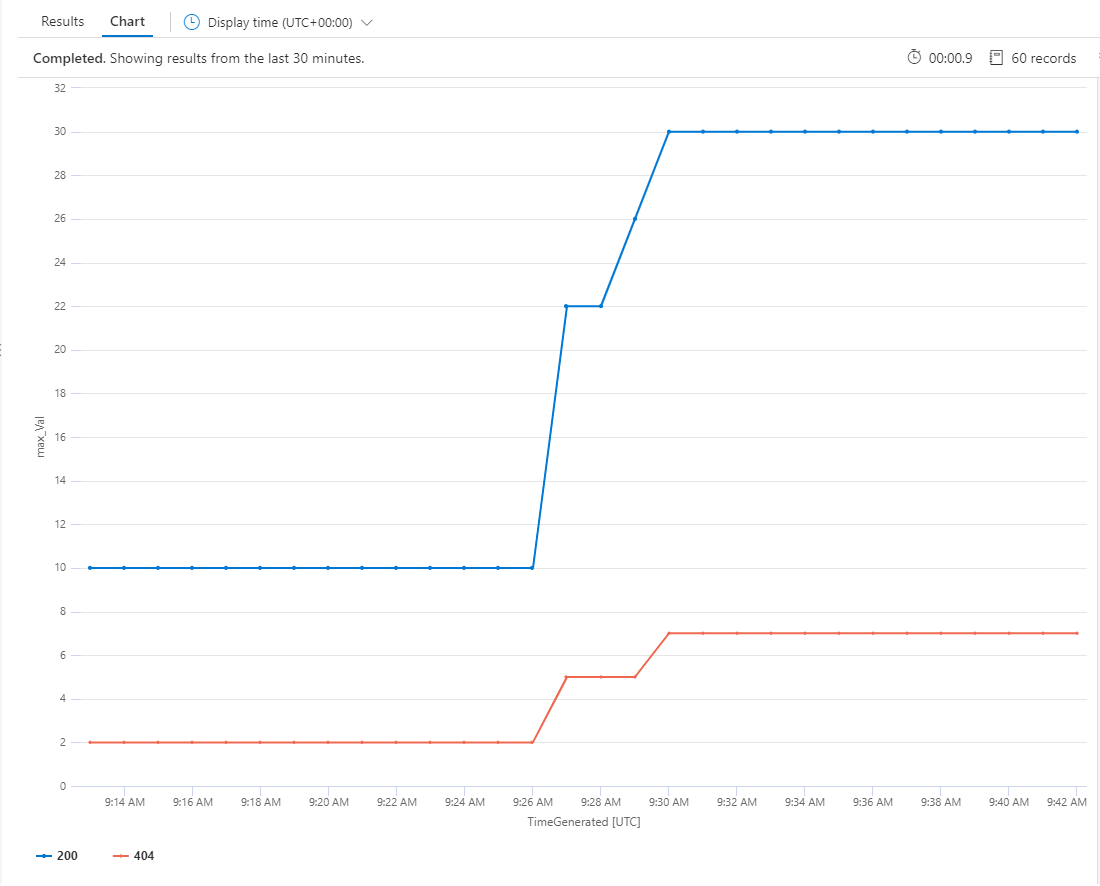
You can pin the query to a shared Azure Dashboard if you want to make it available to operators for quick monitoring or you can even define alerts based on conditions on the result of the query.
Bonus - Configure Grafana to visualize metrics
We have seen that the data can be visualized in the Azure Portal. We can also visualize them in Grafana since version 6.0.0 supports Azure Monitor as datasource.
As Prometheus metrics are stored in Log Analytics, we must set up an Azure Active Directory Application for Azure Monitor Logs.
Create an application registration
The commands below shows how to regster an application and assign it to the correct roles to enable the connection of Grafana to Azure Monitor Metrics, Logs and / or Application Insights.
# Login with Azure CLI
az login
TENANT_ID=`az account show --query tenantId -o tsv`
SUBSCRIPTION_ID=`az account show --query id -o tsv`

ID_NAME="http://spn-grafana-stateless"  # needs to be a URI
CLIENT_SECRET=`az ad sp create-for-rbac --name $ID_NAME --skip-assignment --query password -o tsv`
CLIENT_ID=`az ad sp show --id $ID_NAME --query appId -o tsv`

# Assign The Monitoring Reader role to access Azure Monitor Metrics
RG=...  # the resource group that contains the resources to be monitored
SCOPE=`az group show -g $RG --query id -o tsv`
# Now the you can assign the service principal the required role
az role assignment create --assignee $CLIENT_ID --role "Monitoring Reader" --scope $SCOPE

# Optional: assign Log analytics Reader role to access Azure Monitor Logs
az role assignment create --assignee $CLIENT_ID --role "Log Analytics Reader" --scope $SCOPE

# Optional: create an API key to access Application Insights data
az extension add -n application-insights

APP_INSIGHTS_RG=...  # resource group where the specific application insights resource has been created
APP_INSIGHTS_NAME=...  # name of the specific application insights resource
APP_INSIGHTS_ID=`az monitor app-insights component show -g $APP_INSIGHTS_RG -a $APP_INSIGHTS_NAME \
    --query appId -o tsv`
APP_INSIGHTS_KEY=`az monitor app-insights api-key create -g $APP_INSIGHTS_RG -a $APP_INSIGHTS_NAME \
--api-key Grafana --read-properties ReadTelemetry --query apiKey -o tsv`WARNING: although it should work, I could not get the connection to Azure Monitor Logs to work by restricting the scope of both role assignments to a resource group. I had to assign the roles with a subscription level scope.
Configure Datasource
Login as an admin user in Grafana.
Select Settings -> Datasources -> Add new datasource -> Azure Monitor
Fill-in the required values with the data collected during the creation of the app registration.
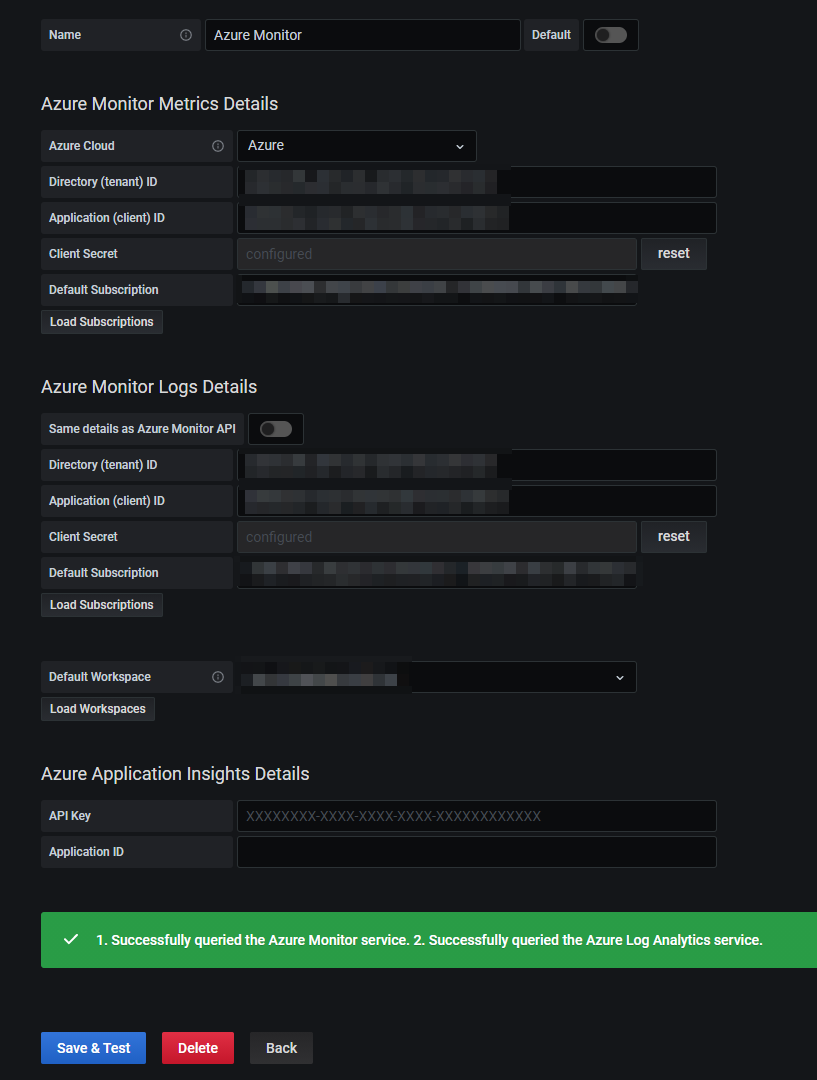
Save and test the datasource.
WARNING: while theoretically you do not have to fill-in the info about your application twice if you use the same for Metrics and Logs, I had to explicitely define the values in Azure Monitor Logs details otherwise I kept getting errors while saving the datasource.
Create a dashboard and try to reproduce the query about the http_requests_total by return code.
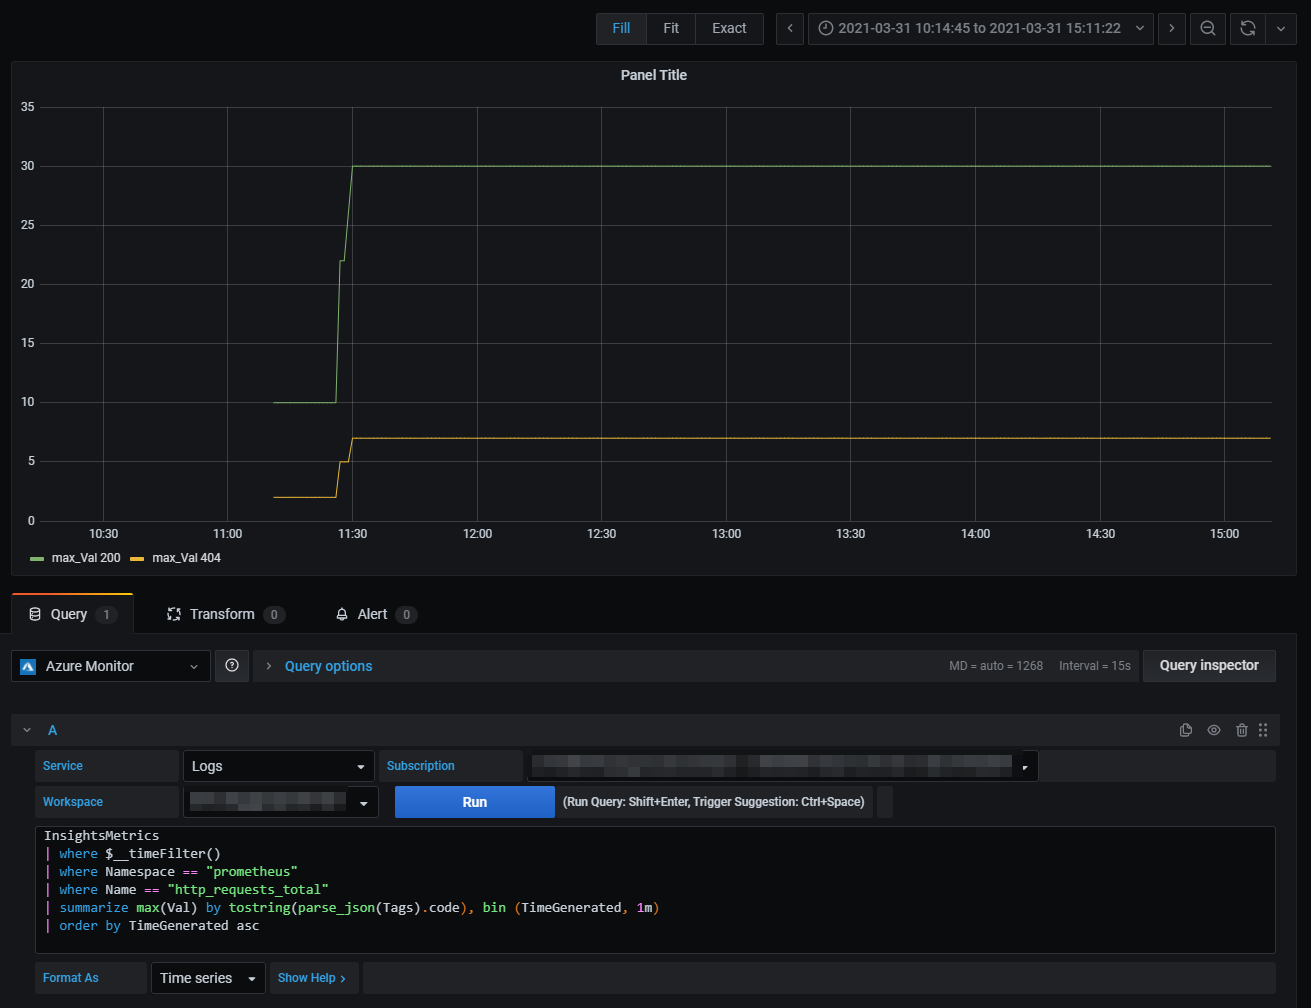
We had to adapt the query a little bit to accomodate some Grafana features like the usage of the $__timeFilter() macro.
Bonus 2 - checking budget consumption of Prometheus data ingestion
As mentioned before, sending data to Log Analytics workspace has a financial impact (there is a cost per gigabyte ingested). The following KQL query is useful to have a view on the volume of ingested Prometheus metrics.
InsightsMetrics
| where Namespace contains "prometheus"
| where TimeGenerated > ago(24h)
| summarize VolumeInGB = (sum(_BilledSize) / (1024 * 1024 * 1024)) by Name
| order by VolumeInGB desc
| render barchart
This will help you keeping track of ingested data and keep your budget under control :)
Conclusion
We demonstrated that it is effectively possible to collect Prometheus exposed metrics and store them into Azure Monitor. We could also query those metrics either through the Azure Portal or Grafana. All is not perfect though and below you’ll find some pros and cons of this solution.
Advantages
- no need to deploy and run one (or more) Prometheus instance(s) at scale.
- if Azure Monitor is already used, one central location to store all logs / metrics.
- use KQL to query metrics - no need to learn PromQL
- integrates with applications instrumented for Prometheus scraping (which are standard nowadays if following principles promoted by CNCF).
- integrates with Grafana dashboards.
Inconvenients
- metrics are stored in Log Analytics workspace that has a cost per gigabyte of data ingested -> monitor closely the budget related to data ingestion.
- PromQL not available to query metrics (cannot re-use work that could have been already done).
- some delay between the moment the metrics are collected and the time they are effectively available in the Log Analytics workspace.
- lack some flexibility in how data can be collected (some settings are cluster-wide only).
Adopting Azure Monitor for such a use case depends on the strategy defined for Metrics and Logs and the comfort the developers / operations engineers have with the query languages.
I hope it was useful. See you later.
