Today we will try to configure a Kubernetes cluster, not hosted on __AWS infrastructure, and send metrics to an Amazon Managed Prometheus (aka AMP) workspace.
WARNING : AMP is at that time (03/2021) a service in preview and is thus not yet production ready.
Architecture
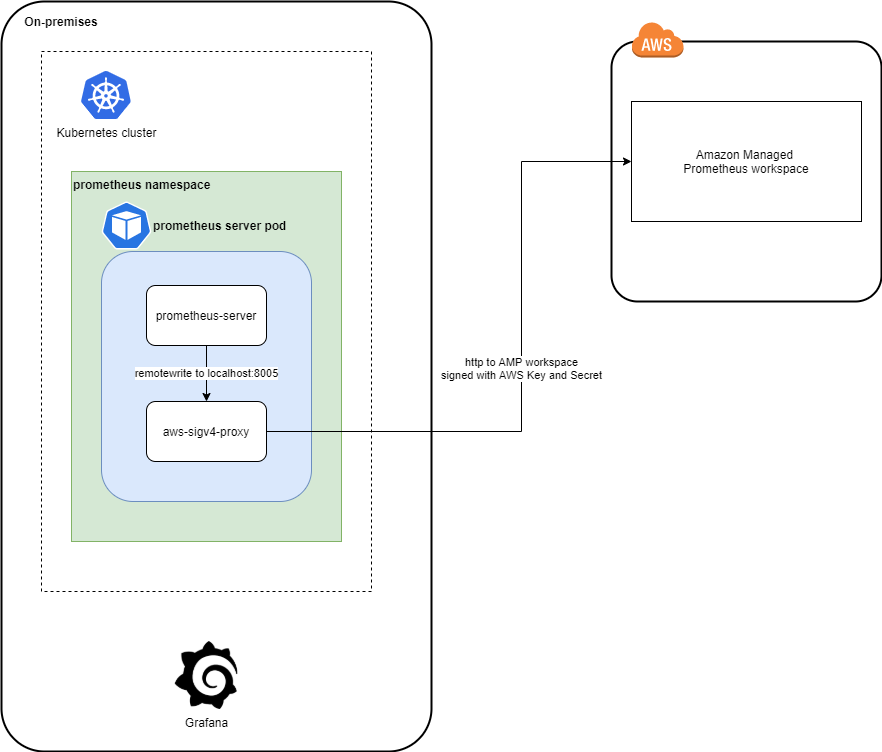
The architecture is composed of the following components.
On-premises (on my local workstation)
- A test Kubernetes cluster (deployed with
kind) in which we will deploy Prometheus to collect metrics before sending them to AMP workspace - A Grafana docker container
In AWS (region eu-west-1)
- an AMP workspace.
Create an Amazon Managed Prometheus workspace
Login to your AWS console as an administrator.
Check that you work in the correct region.
Search for Amazon Prometheus.
Fill in a workspace name and click Create.
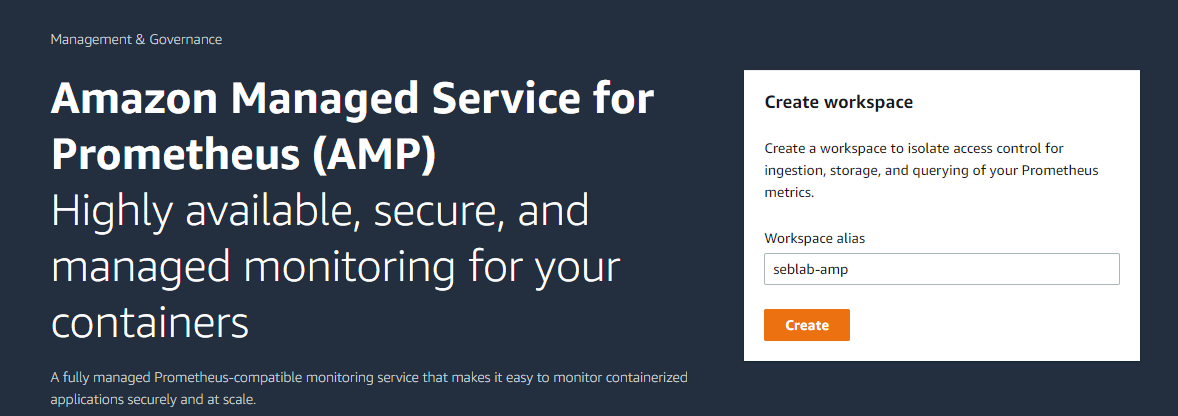
After a few seconds, the AMP workspace is created.

Note the region, the workspace ID and the workspace endpoint URL. You will need them later on.
Create AWS IAM identity with RemoteWrite access to the AMP workspace
All the documentation available on the subject is based on usage of IAM roles. To use those roles, the infrastructure must be hosted on AWS (ECS, EKS, etc …). As the focus of this test is to be able to configure a non AWS hosted Kubernetes cluster, we will need to rely on the good old AWS credentials configuration for Go SDK.
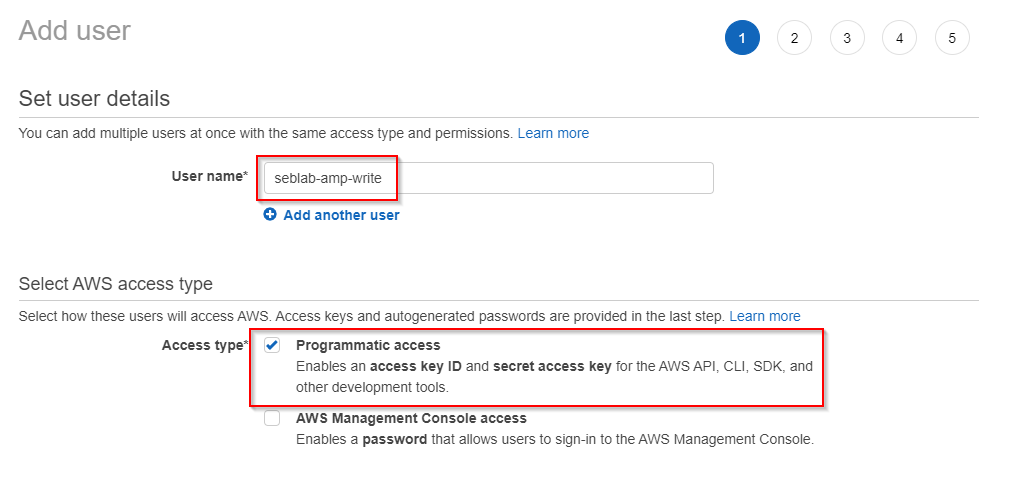
Create a new IAM user only for programmatic access
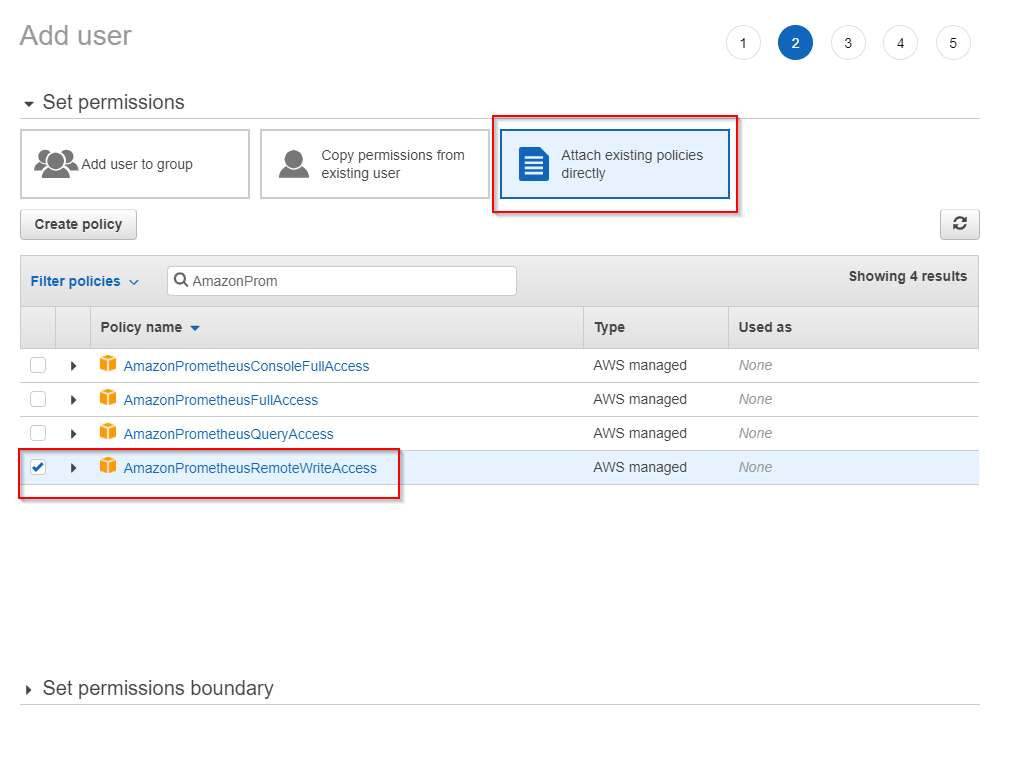
Give this identity the permission to RemoteWrite in the previously deployed AMP workspace. This can be achieved using the built-in AWS managed policy AmazonPrometheusRemoteWriteAccess that grant the permission to all AMP workspace in the AWS account.
Check AMP IAM permissions and policies documentation for more info.
Save the Access key ID and the Secret access key to a password safe.
Create a Kubernetes test cluster
I used kind to create a test Kubernetes cluster.
kind create cluster --name kind-ampDeploy Prometheus into the Kubernetes cluster using Helm chart
helm repo add prometheus-community https://prometheus-community.github.io/helm-charts
kubectl create ns prometheus
helm install prometheus-amp prometheus-community/prometheus -n prometheus
Check that the Prometheus stack has been correctly deployed.
export POD_NAME=$(kubectl get pods --namespace prometheus -l "app=prometheus,component=server" \
-o jsonpath="{.items[0].metadata.name}")
kubectl --namespace prometheus port-forward $POD_NAME 9090
Open a web browser and browse to http://localhost:9090.
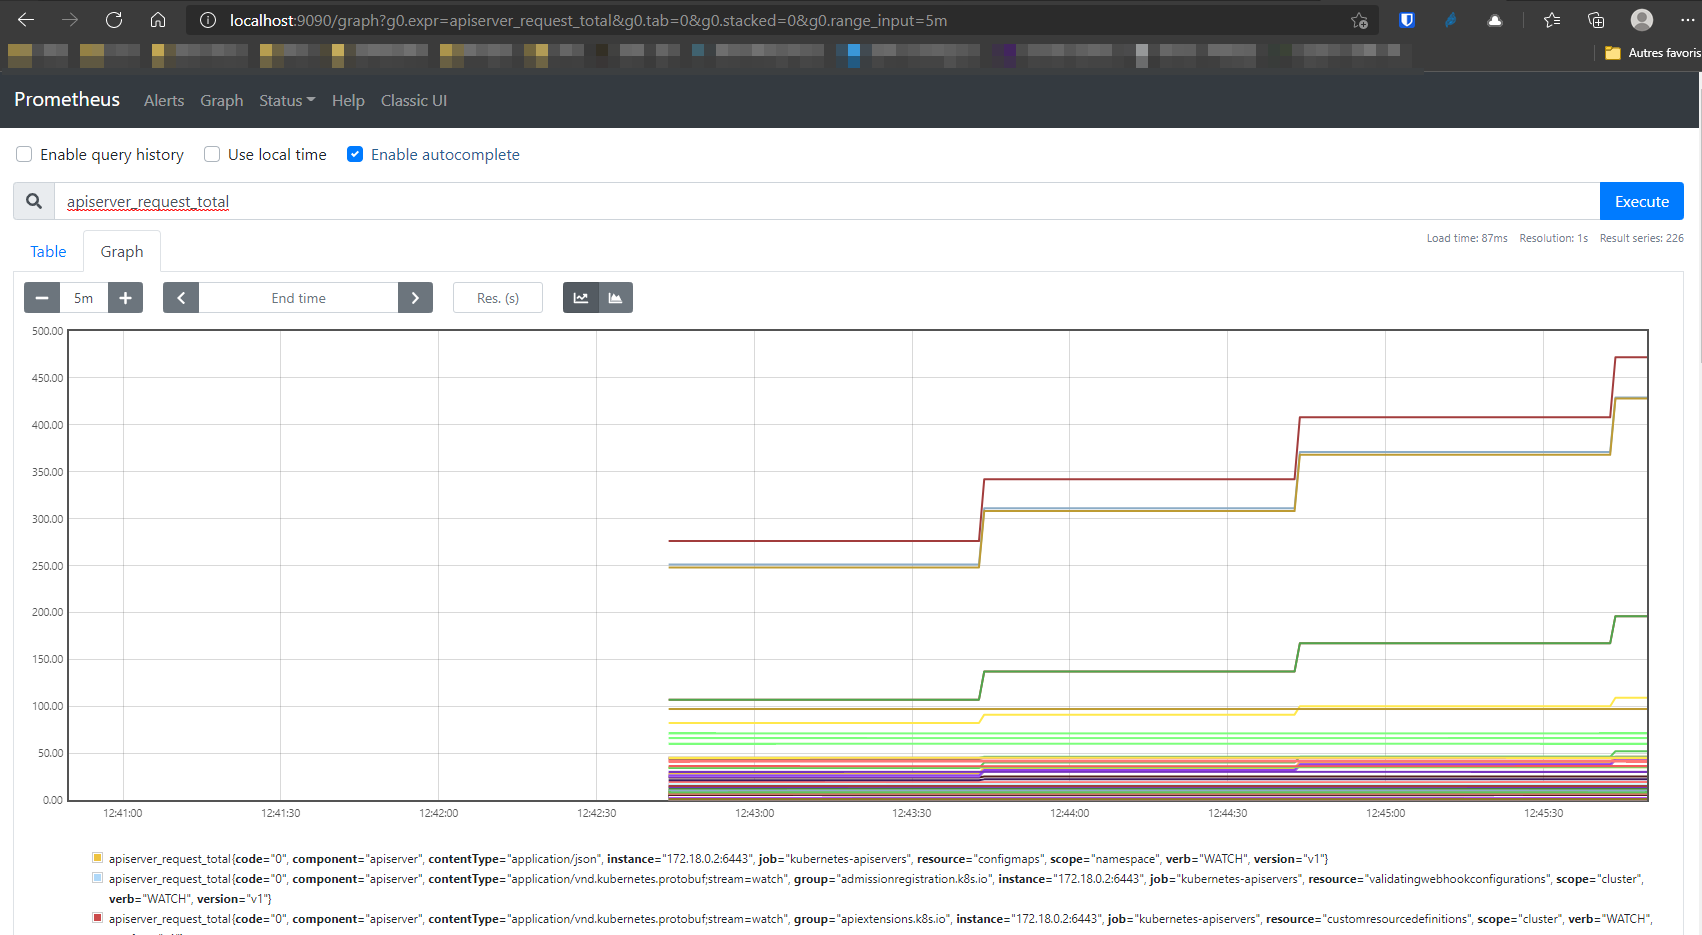
Prometheus is deployed in the cluster. Now we’ll have to patch the deployment to add a sidecar aws-sigv4-proxy container in the server pod and assign to that container the AWS identity created at the start of this article. This step is mandatory because all requests sent to the AMP workspace endpoint must be signed with AWS SigV4 protocol. As Prometheus remote write protocol does not support that natively, we will redirect the trafic to the proxy container that will sign the requests and forward them to the correct AWS service / region.
To patch the deployment, create a YAML patch file with the following content
server:
  sidecarContainers:
    aws-sigv4-proxy-sidecar:
        image: public.ecr.aws/aws-observability/aws-sigv4-proxy:1.0
        env:
        - name: AWS_ACCESS_KEY_ID
          value: "Your_AWS_ACCESS_KEY_ID"
        - name: AWS_SECRET_ACCESS_KEY
          value: "Your_AWS_SECRET_ACCESS_KEY"
        args:
        - --name
        - aps
        - --host
        - aps-workspaces.eu-west-1.amazonaws.com
        - --region
        - eu-west-1
        - --port
        - :8005
        ports:
        - name: aws-sigv4-proxy
          containerPort: 8005
  statefulSet:
      enabled: "true"
  remoteWrite:
- url: http://localhost:8005/workspaces/ws-b8cabc19-a532-42d1-a717-8f39398fb4ab/api/v1/remote_writeWARNING: the patch file is highly insecure as it defines AWS_ACCESS_KEY_ID and AWS_SECRET_ACCESS_KEY as environment variable in clear text. It would be best to use Kubernetes secrets for this kind of information.
Apply the file
helm upgrade --install prometheus-amp prometheus-community/prometheus -n prometheus \
-f ./amp_ingest_override_values.yaml
Now that everything is in place in the Kubernetes cluster, let’s deploy and configure a Grafana instance to connect to the AMP workspace and check if data are coming in.
Install Grafana docker container to connect to AMP workspace
Run the following command to start a Grafana container.
docker run -d \
  -p 3000:3000 \
  --name=amp-grafana \
  -e "GF_AUTH_SIGV4_AUTH_ENABLED=true" \
  -e "AWS_SDK_LOAD_CONFIG=true"\
grafana/grafanaGF_AUTH_SIGV4_AUTH_ENABLED=trueenables the use of AWS v4 signature for request to AMP workspace.AWS_SDK_LOAD_CONFIG=trueenables the load of connection data (credentials and AWS region) from aconfigfile (read documentation for more details)
Login to the Grafana instance as administrator (admin / admin -> change the password).
Configure a Prometheus datasource (full documentation available here).
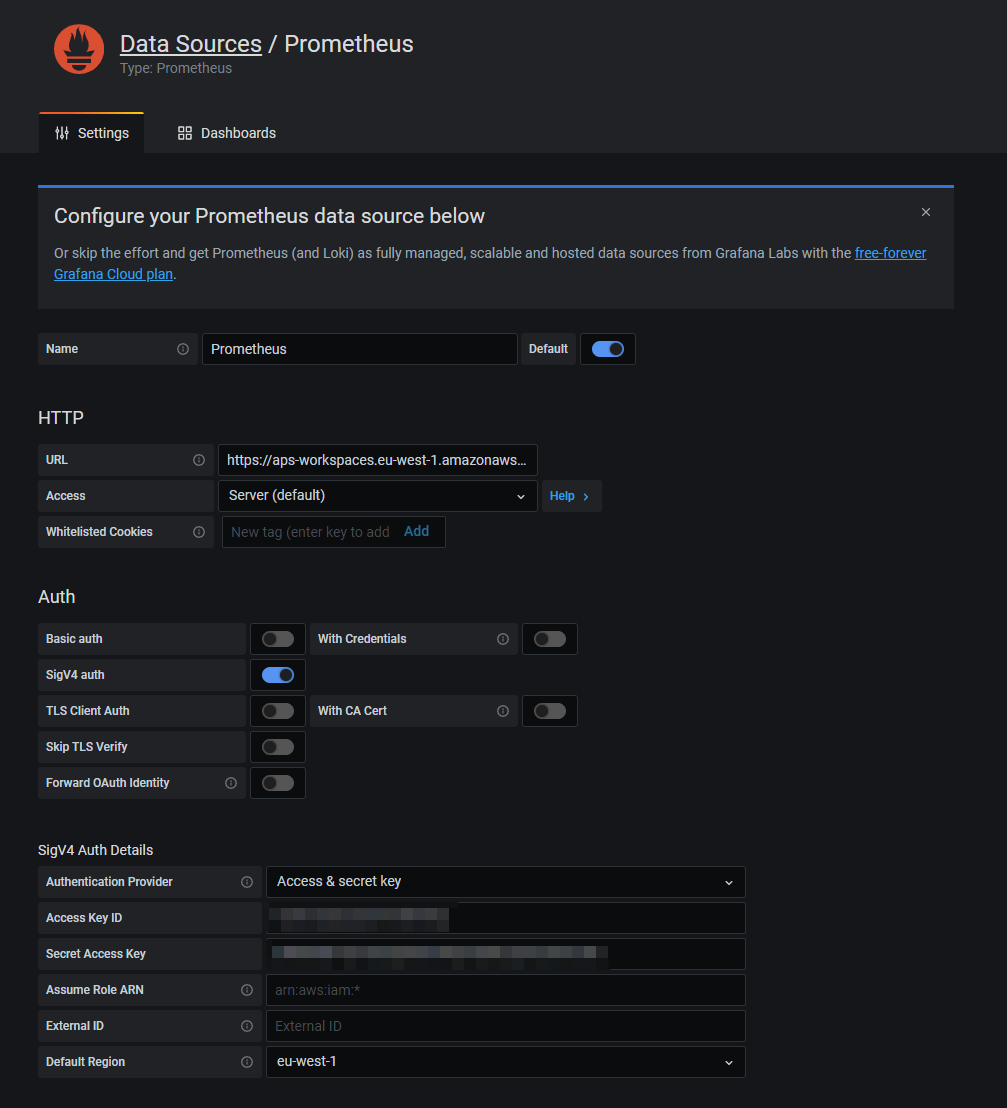
- URL endpoint must be the AMP endpoint without
/api/v1/querystring. Example:https://aps-workspaces.{region}.amazonaws.com/workspaces/{workspace-id} - Enable SigV4 auth
Choose Access & secret key for SigV4 Auth Details and fill in both values in the corresponding fields.
WARNING: this method is ok for a test deployment. For production deployment, AWS recommends using
AWS SDK Default.
Fill in the region that must correspond to the region in the URL endpoint.
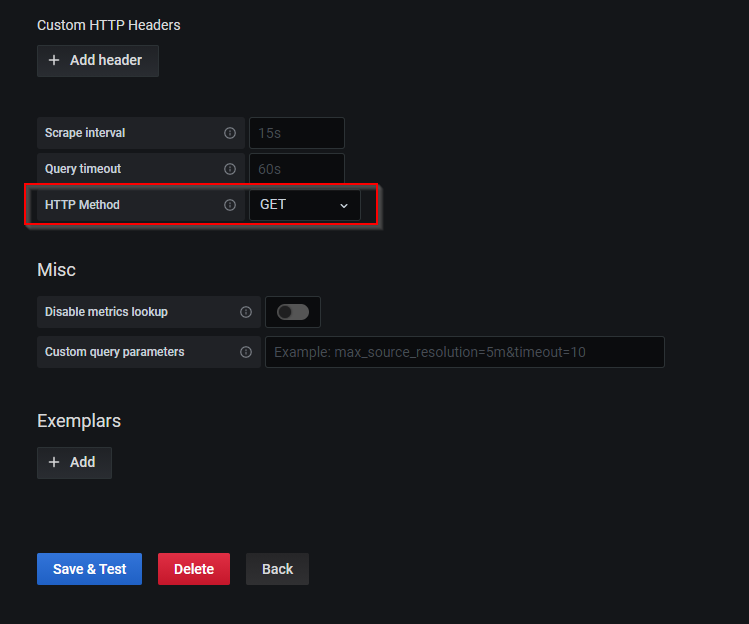
Change the HTTP Method from PUT to GET
Save and test the datasource. If everything went nicely, it should be ok.
Go to Explore and check if metrics are available.
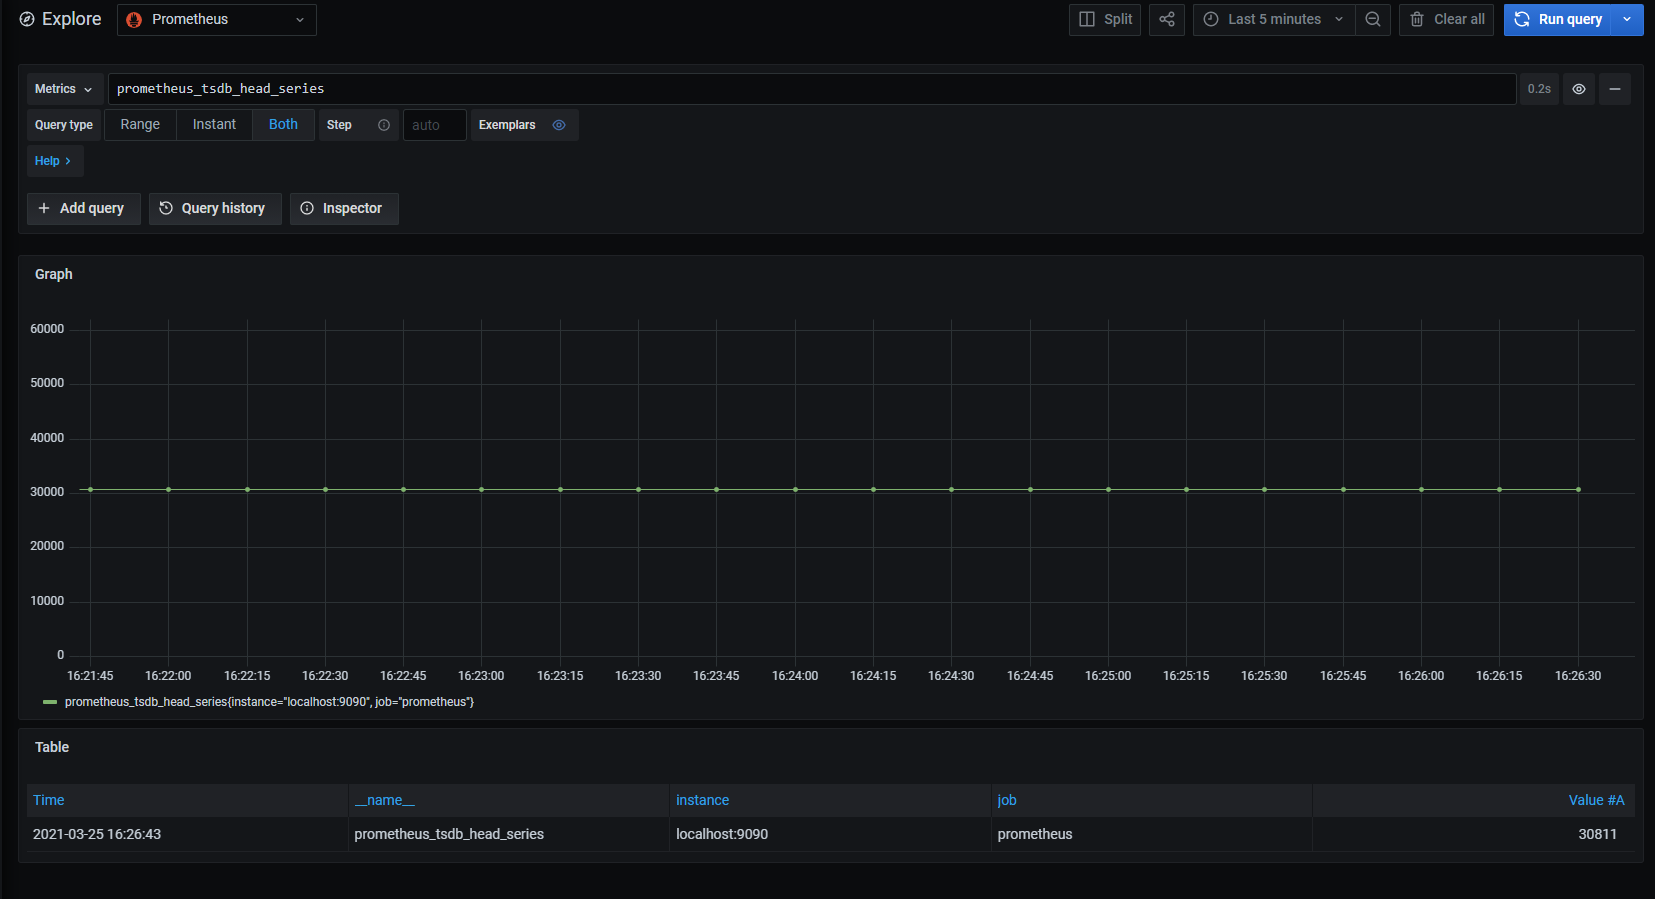
Metrics are flowing in, we have reached our destination.
Don’t forget to clean up (delete) all resources because Kubernetes send a lot of metrics to Prometheus by default ;)
