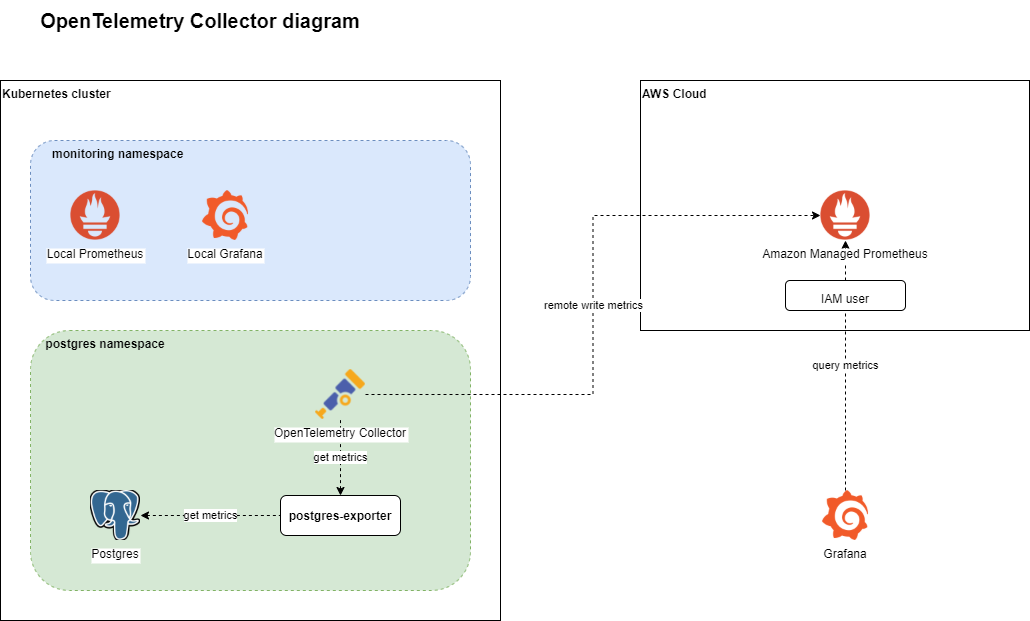
Today I refine the configuration described in my past article where I tested the sending of metrics from a non AWS hosted Kubernetes cluster to Amazon Managed service for Prometheus (aka AMP). At that time, I did setup a Prometheus instance in the Kubernetes cluster and configured it to send metrics to AMP through Remote Write configuration.
Here, I setup OpenTelemetry Collector to replace the Prometheus instance. The idea is to use a lighter and more versatile process to collect metrics and send them to a remote backend. The OpenTelemetry project offers all components for the creation and management of telemetry data such as metrics, traces and logs. It’s part of CNCF’s sandbox projects, vendor agnostic and in the process of implementation in numerous cloud services (Datadog, New Relic, AWS, Azure, etc …)
The architecture

I will deploy the OpenTelemetry Collector inside the postgres namespace to scrape metrics from the postgres-exporter pod and send them to an AMP workspace.
Setup AMP workspace
Run the following Terraform code to deploy an AMP workspace.
terraform {
  required_providers {
    aws = {
      source = "hashicorp/aws"
      version = "3.37.0"
    }
  }
}

provider "aws" {
  # Configuration options
  region = "eu-west-1"
}

resource "aws_prometheus_workspace" "amp" {
  alias = "otel-test"
}

# Create a user for access to AMP workspace
resource "aws_iam_user" "amp-user" {
  name = "amp-user-tf"

  tags = {
    terraform = "true"
  }
}

# Create an access key and a secret
resource "aws_iam_access_key" "amp" {
  user = aws_iam_user.amp-user.name
}

# Attach some standard policies to the user to query and ingest data
# This could be split between different users for more security
resource "aws_iam_user_policy_attachment" "amp-attach-qaccess" {
  user       = aws_iam_user.amp-user.name
  policy_arn = "arn:aws:iam::aws:policy/AmazonPrometheusQueryAccess"
}

resource "aws_iam_user_policy_attachment" "amp-attach-remotewriteaccess" {
  user       = aws_iam_user.amp-user.name
  policy_arn = "arn:aws:iam::aws:policy/AmazonPrometheusRemoteWriteAccess"
}

# Output some data
output "AMP_endpoint" {
  value = "AMP endpoint: ${aws_prometheus_workspace.amp.prometheus_endpoint}"
}

output "AMP_keys" {
  value = "Access Key: ${aws_iam_access_key.amp.id} / Secret key: ${aws_iam_access_key.amp.secret}"
}
Take note of the AMP endpoint and AWS access key id and secret of the new user. These are needed later on.
Deploy OpenTelemetry Collector in Kubernetes
The first thing to do is to choose a deployment model for the OpenTelemetry Collector. Everything is possible and the choice of the correct model depends on the usage being made of the collector.
To help with the choice, read the following resources
- Deploying the OpenTelemetry Collector on Kubernetes article on Medium
- The Getting Started official documentation of the OpenTelemetry project
Besides those resources, take also into account the receiver type to use. As I will only use the Prometheus receiver, I need to take into account the limitations relative to it which are:
- Collector cannot auto-scale the scraping yet when multiple replicas of the collector is run.
- When running multiple replicas of the collector with the same config, it will scrape the targets multiple times.
- Users need to configure each replica with different scraping configuration if they want to manually shard the scraping.
- The Prometheus receiver is a stateful component.
To avoid having metrics scraped multiple times, I will deploy the OpenTelemetry Collector as a Kubernetes deployment with only one replica inside the namespace containing the resources to monitor (postgres).
The next thing to take care of is the choice of the version of the OpenTelemetry Collector to deploy. There exists indeed multiple official container images of the collector. In this case, I use opentelemetry-collector-contrib image as it contains contributor specific enhancements like awsprometheusremotewriteexporter that enables to send metrics from the collector to an AMP workspace without the need of the AWS Sigv4 proxy sidecar container.
Reminder: all requests sent to an AMP workspace must be signed with AWS Sigv4! The standard OpenTelemetry Collector does support Prometheus Remote Write exporter but not AWS Sigv4 trafic.
Let’s create the stuff now!
Create a service account otel-collector-sa in namespace postgres
apiVersion: v1
kind: ServiceAccount
metadata:
  name: otel-collector-sa
  namespace: postgres
Create a cluster role otel-collector-cr that allow the access to pod informations for scraping.
apiVersion: rbac.authorization.k8s.io/v1
kind: ClusterRole
metadata:
  labels:
    app: opentelemetry
    component: otel-collector
  name: otel-collector-cr
rules:
- apiGroups:
  - ""
  resources:
  - nodes
  - nodes/metrics
  - services
  - endpoints
  - pods
  verbs:
  - get
  - list
  - watch
- apiGroups:
  - networking.k8s.io
  resources:
  - ingresses
  verbs:
  - get
  - list
  - watch
- nonResourceURLs:
  - /metrics
  - /metrics/cadvisor
  verbs:
  - get
Finally create a cluster role binding to bind the role otel-collector-cr to the service account otel-collector-sa in namespace postgres.
apiVersion: rbac.authorization.k8s.io/v1
kind: ClusterRoleBinding
metadata:
  labels:
    app: opentelemetry
    component: otel-collector
  name: otel-collector-crb
roleRef:
  apiGroup: rbac.authorization.k8s.io
  kind: ClusterRole
  name: otel-collector-cr
subjects:
- kind: ServiceAccount
  name: otel-collector-sa
  namespace: postgres
Without those 3 tasks, I got the following errors in the logs of the collector
E0427 11:14:59.157773       1 reflector.go:138]
pkg/mod/k8s.io/[email protected]/tools/cache/reflector.go:167:
Failed to watch *v1.Pod: failed to list *v1.Pod: pods is forbidden:
User "system:serviceaccount:postgres:default" cannot list resource
"pods" in API group "" at the cluster scope
Create a Kubernetes Secret otel-collector-aws-creds in namespace postgresthat will contains your AWS credentials.
kubectl create secret generic otel-collector-aws-creds \
  --from-literal=AWS_ACCESS_KEY_ID=<your AWS Access Key> \
  --from-literal=AWS_SECRET_ACCESS_KEY=<your AWS Secret Key> \
  -n postgres
Mount the secret’s keys as environment variables so that they can be picked by awsprometheusremotewrite exporter. This exporter uses the AWS default credential provider chain to find AWS credentials.
Create the OpenTelemetry Collector’s ConfigMap.
apiVersion: v1
kind: ConfigMap
metadata:
  name: otel-collector-conf
  namespace: postgres
  labels:
    app: opentelemetry
    component: otel-collector-conf
data:
  config.yaml: |-
    receivers:
      prometheus:
        config:
          scrape_configs:

            - job_name: 'otel-collector'
              scrape_interval: 5s
              static_configs:
                - targets: ['0.0.0.0:8888']

            - job_name: kubernetes-pods
              kubernetes_sd_configs:
              - role: pod
                namespaces:
                  names:
                    - postgres
              relabel_configs:
              - source_labels: [__meta_kubernetes_pod_annotation_prometheus_io_scrape]
                regex: true
                action: keep
              - source_labels: [__meta_kubernetes_pod_annotation_prometheus_io_scheme]
                action: replace
                regex: (https?)
                target_label: __scheme__
              - source_labels: [__meta_kubernetes_pod_annotation_prometheus_io_path]
                action: replace
                target_label: __metrics_path__
                regex: (.+)
              - source_labels: [__address__, __meta_kubernetes_pod_annotation_example_io_scrape_port]
                action: replace
                regex: ([^:]+)(?::\d+)?;(\d+)
                replacement: $1:$2
                target_label: __address__
              - action: labelmap
                regex: __meta_kubernetes_pod_label_(.+)
              - source_labels: [__meta_kubernetes_namespace]
                action: replace
                target_label: kubernetes_namespace
              - source_labels: [__meta_kubernetes_pod_name]
                action: replace
                target_label: kubernetes_pod_name
              - source_labels: [__meta_kubernetes_pod_phase]
                regex: Pending|Succeeded|Failed
                action: drop

    exporters:
      awsprometheusremotewrite:
        retry_on_failure:
          enabled: true
          initial_interval: 10s
          max_interval: 60s
          max_elapsed_time: 10m
        endpoint: "https://aps-workspaces.eu-west-1.amazonaws.com/workspaces/ws-54770de3-1591-4782-8b7f-fe867e858c79/api/v1/remote_write"
        aws_auth:
          service: "aps"
          region: "eu-west-1"

    service:
      pipelines:
        metrics:
          receivers: [prometheus]
          exporters: [awsprometheusremotewrite]
The configuration of the OpenTelemetry Collector is very simple.
The receivers: part describe the entry points for data. Here I only defined one receiver of type prometheus. The configuration of this receiver accepts the same syntax as a standard Prometheus instance making it very easy to configure.
There are 2 scrape jobs configured.
- Job
otel-collectorscrapes metrics from the OpenTelemetry Collector itself. - Job
kubernetes-podsscrapes metrics from pods that have the annotationprometheus.io/scrape = true
The following annotations are used by the collector scrape_config to enhance the scraping experience.
| Annotation | Purpose |
|---|---|
prometheus.io/scrape |
If set to "true" then the pod will be scraped by Opentelemetry Collector. |
prometheus.io/path |
Use to specify a path different than /metrics to scrape metrics. |
prometheus.io/port |
Use to specify a port to scrape metrics. |
There is no processors: section in my configuration as I do not process data coming in through receivers.
The exporters: section defines where data collected must be sent. In this case, I use a contributor exporter named awsprometheusremotewrite that is not present in the standard OpenTelemetry Collector (that’s the reason why I used the otel/otel-collector-contrib container image). Apart from the endpoint parameter, you also need to specify the following section :
aws_auth:
  service: "aps"
  region: "eu-west-1"
Off course, the region must match the AWS region where the AMP workspace is deployed. Without these parameters, I received error 403 - forbidden when sending metrics to the workspace.
I do not create a Kubernetes service because the OpenTelemetry Collector scrapes metrics and does not receive them. It must be taken into account if the collector is also used to collect logs and traces. In that case, other pods must be able to send data to it and a service is mandatory.
Create a deployment in namespace postgres.
apiVersion: apps/v1
kind: Deployment
metadata:
  name: otel-collector
  namespace: postgres
  labels:
    app: opentelemetry
    component: otel-collector
spec:
  replicas: 1
  selector:
    matchLabels:
      app: opentelemetry
      component: otel-collector
  template:
    metadata:
      labels:
        app: opentelemetry
        component: otel-collector
    spec:
      serviceAccountName: otel-collector-sa
      containers:
      - name: otel-collector
        image: otel/opentelemetry-collector-contrib:0.24.0
        envFrom:
          - secretRef:
              name: otel-collector-aws-creds
        ports:
        - containerPort: 8888
        volumeMounts:
        - name: config
          mountPath: /etc/otel/config.yaml
          subPath: config.yaml
          readOnly: true
      volumes:
        - name: config
          configMap:
            name: otel-collector-conf
Check the deployment.
kubectl get all -n postgres --selector=app=opentelemetry
NAME                                  READY   STATUS    RESTARTS   AGE
pod/otel-collector-86cc7fb7d7-h4ngw   1/1     Running   0          110m

NAME                             READY   UP-TO-DATE   AVAILABLE   AGE
deployment.apps/otel-collector   1/1     1            1           110m

NAME                                        DESIRED   CURRENT   READY   AGE
replicaset.apps/otel-collector-86cc7fb7d7   1         1         1       110m
Check the logs of the collector.
kubectl logs pod/otel-collector-86cc7fb7d7-h4ngw -n postgres
2021-04-28T12:34:33.064Z        info    service/application.go:280      Starting OpenTelemetry Contrib Collector...    {"Version": "v0.24.0", "GitHash": "f564404d", "NumCPU": 3}
2021-04-28T12:34:33.064Z        info    service/application.go:215      Setting up own telemetry...
2021-04-28T12:34:33.066Z        info    service/telemetry.go:98 Serving Prometheus metrics      {"address": ":8888", "level": 0, "service.instance.id": "d6c38367-1773-4c92-815d-db4a3fb48d2a"}
2021-04-28T12:34:33.066Z        info    service/application.go:250      Loading configuration...
2021-04-28T12:34:33.070Z        info    service/application.go:257      Applying configuration...
2021-04-28T12:34:33.071Z        info    builder/exporters_builder.go:274        Exporter was built.     {"kind": "exporter", "exporter": "awsprometheusremotewrite"}
2021-04-28T12:34:33.071Z        info    builder/pipelines_builder.go:204        Pipeline was built.     {"pipeline_name": "metrics", "pipeline_datatype": "metrics"}
2021-04-28T12:34:33.071Z        info    builder/receivers_builder.go:230        Receiver was built.     {"kind": "receiver", "name": "prometheus", "datatype": "metrics"}
2021-04-28T12:34:33.071Z        info    service/service.go:155  Starting extensions...
2021-04-28T12:34:33.071Z        info    service/service.go:200  Starting exporters...
2021-04-28T12:34:33.071Z        info    builder/exporters_builder.go:92 Exporter is starting... {"kind": "exporter", "name": "awsprometheusremotewrite"}
2021-04-28T12:34:33.071Z        info    builder/exporters_builder.go:97 Exporter started.       {"kind": "exporter", "name": "awsprometheusremotewrite"}
2021-04-28T12:34:33.071Z        info    service/service.go:205  Starting processors...
2021-04-28T12:34:33.071Z        info    builder/pipelines_builder.go:51 Pipeline is starting... {"pipeline_name": "metrics", "pipeline_datatype": "metrics"}
2021-04-28T12:34:33.071Z        info    builder/pipelines_builder.go:62 Pipeline is started.    {"pipeline_name": "metrics", "pipeline_datatype": "metrics"}
2021-04-28T12:34:33.071Z        info    service/service.go:210  Starting receivers...
2021-04-28T12:34:33.071Z        info    builder/receivers_builder.go:70 Receiver is starting... {"kind": "receiver", "name": "prometheus"}
2021-04-28T12:34:33.072Z        info    kubernetes/kubernetes.go:264    Using pod service account via in-cluster config{"kind": "receiver", "name": "prometheus", "discovery": "kubernetes"}
2021-04-28T12:34:33.085Z        info    builder/receivers_builder.go:75 Receiver started.       {"kind": "receiver", "name": "prometheus"}
2021-04-28T12:34:33.086Z        info    service/application.go:227      Everything is ready. Begin running and processing data.
As everything seems allright, let’s configure a Grafana instance to see if metrics are flowing in the AMP workspace.
Grafana setup
Warning: this Grafana setup is only meant to test and not to last!
I started Grafana as a container on my workstation to quickly test the configuration
docker run -d \
  -p 3000:3000 \
  --name=amp-grafana \
  -e "GF_AUTH_SIGV4_AUTH_ENABLED=true" \
  -e "AWS_SDK_LOAD_CONFIG=true"\
  grafana/grafana
After the setup of the data source (see my past article), quickly play with a dashboard to visualize OpenTelemetry Collector metrics.

Conclusion
The OpenTelemetry Collector is a really nice alternative to the deployment of a Prometheus instance if you’re only using it as a “relay” to send metrics to a remote backend. It consumes less data and accepts the same scraping configurations. It is vendor agnostic and enables to change the remote backend without too much hassle. It is also very versatile as it can be used to collect logs and traces and offers a robust base to setup observability in your Kubernetes cluster.
