Welcome cloud traveller and take a seat to read the wonderful story on how to monitor your Kapsule cluster with Grafana Cloud!
In older articles on this blog, I already explored some ways to monitor my Kubernetes Kapsule cluster hosted at Scaleway. As I’m running a very small managed cluster, hosting a full Prometheus install consumes quite some resources and I was looking for an alternative.
I have already tested the deployment of OpenTelemetry Collector Agent in combination with AWS Managed Prometheus and that was working well. Nonetheway, I still had to deploy and configure Grafana for visualization. Furthermore, this solution is only good at storing metrics but there is nothing concerning logs and traces.
With that in mind, I decided to give a try at Grafana Cloud which is a combination of the following managed services:
- Grafana for dashboarding / visualization / alerting.
- Prometheus at scale (Cortex).
- Logs management (with Loki).
- Distributed traces management (with Tempo).
All these components are managed by Grafana and are available as a free (forever) tier.
In this article, I will focus on the metrics part. There will be 2 additional articles for logs and traces.
Grafana Cloud setup
The concept is very simple.
First you create a free tier account.
After a few seconds (max one minute), your environment will be ready. You will be logged in into a hosted Grafana instance with some additional content if you compare with the open source version.
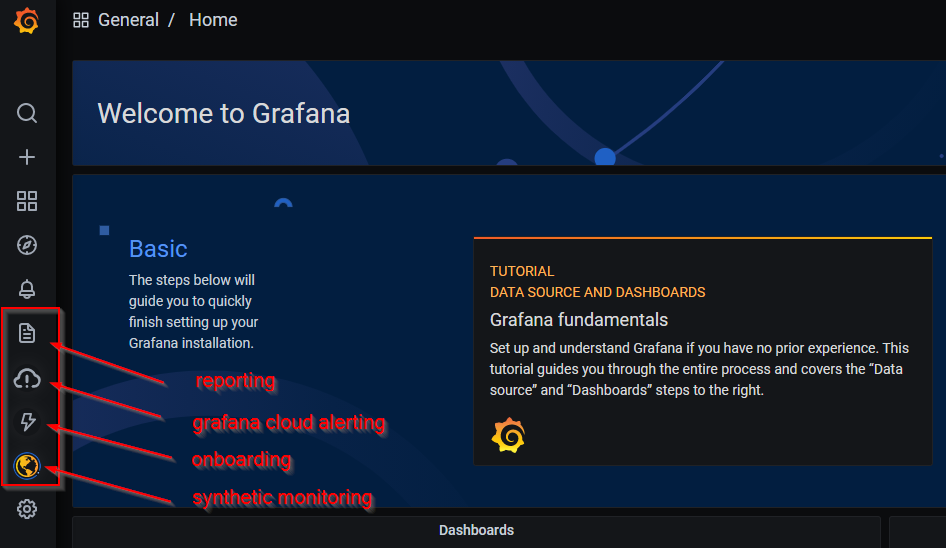
Click on onboarding -> walkthrough and it will display a page detailing the multiple available integrations.

As I wanted to monitor my Kubernetes cluster, I chose the Kubernetes tile then select Configure service button at the bottom of the page.
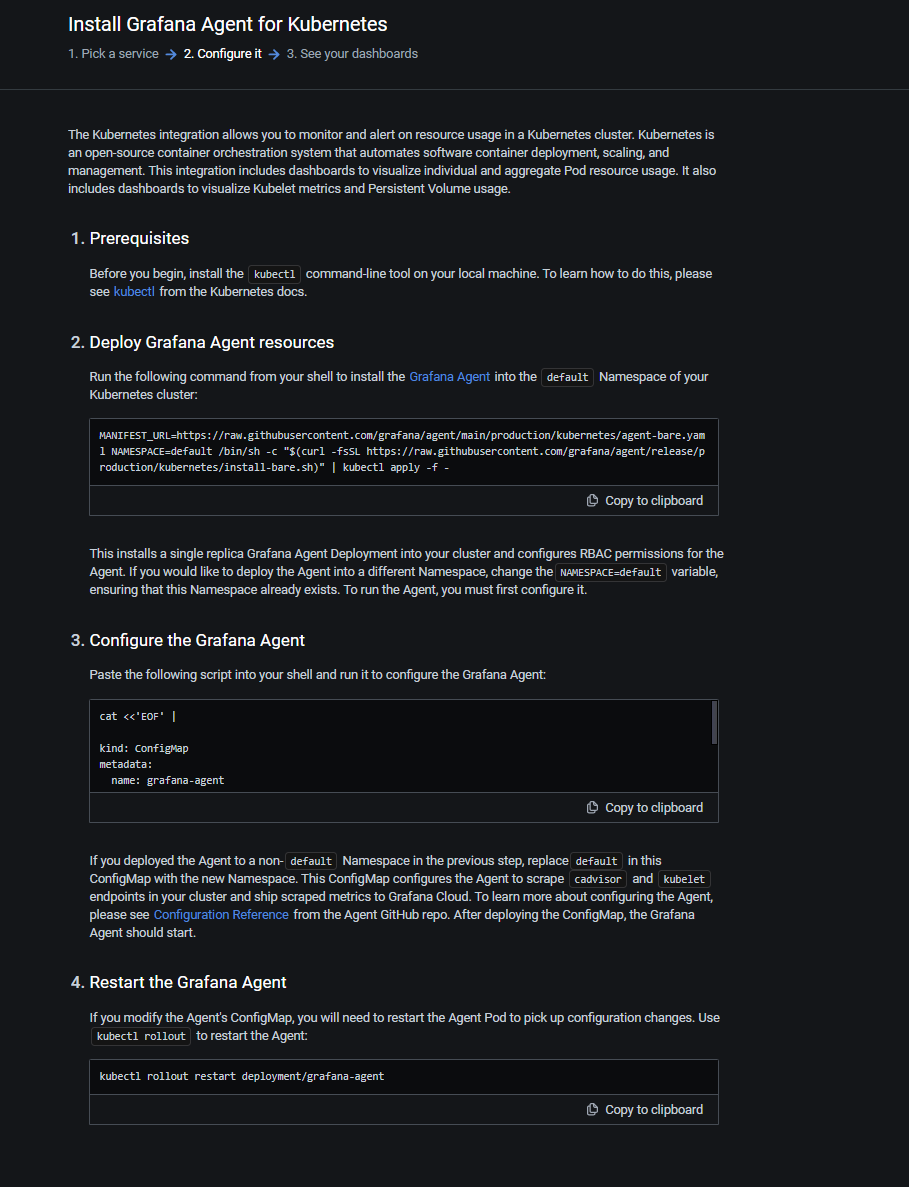
Follow the 4 steps described on the page. Don’t forget to have a look at the scripts before executing them (we’re never cautious enough). Run these steps to deploy a Grafana Agent in your cluster that is configured to scrape metrics from cadvisor and kubelet and send them to your Prometheus instance of Grafana Cloud.
Note: the generated scripts do contain your
client idandsecretto connect your Grafana Cloud instance.
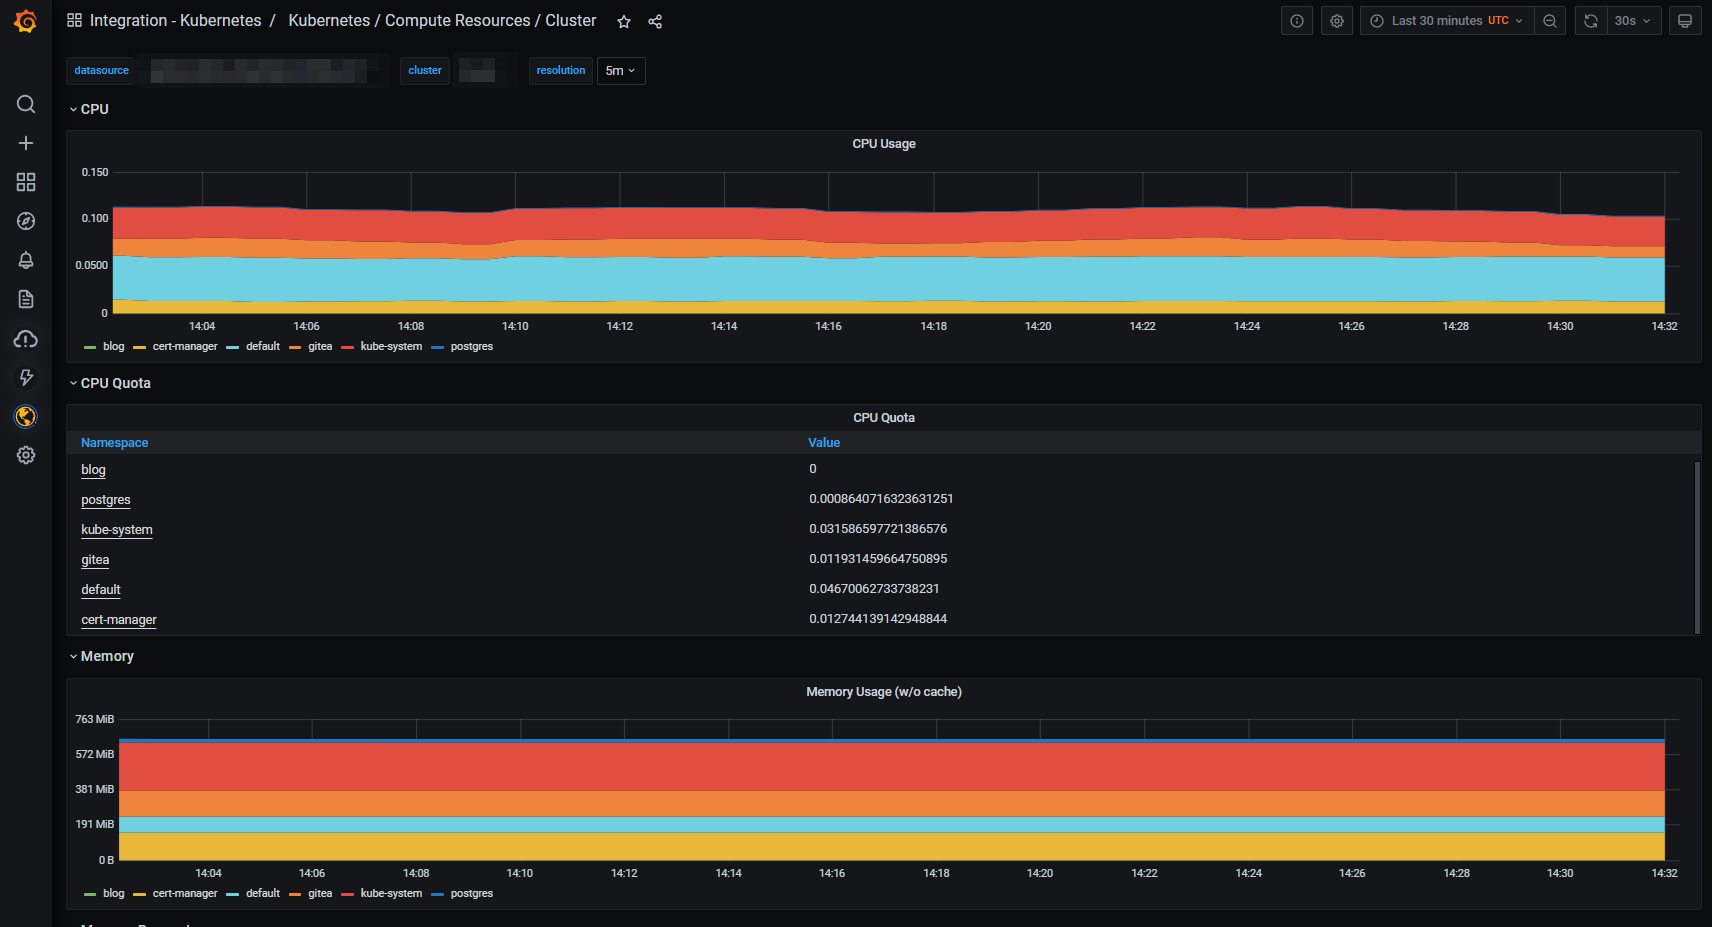
When the resources are deployed in your cluster, click Test integration and finish installation button at the bottom of the page. It should take at most one minute before it succeeds and voilà … metrics are flowing into your Grafana Cloud and you have some standard dashboards ready to use.
Grafana Agent standard configuration for Kubernetes integration
Below you’ll find the content of the Grafana Agent configmap deployed by the Kubernetes integration.
server:
  http_listen_port: 12345
prometheus:
  wal_directory: /tmp/grafana-agent-wal
  global:
    scrape_interval: 1m
    external_labels:
      cluster: <some cluster name>
  configs:
  - name: integrations
    remote_write:
    - url: https://prometheus-blocks-prod-us-central1.grafana.net/api/prom/push
      basic_auth:
        username: <your Grafana Cloud user name>
        password: <your Grafana Cloud password>
    scrape_configs:
    - job_name: integrations/kubernetes/cadvisor
      bearer_token_file: /var/run/secrets/kubernetes.io/serviceaccount/token
      kubernetes_sd_configs:
        - role: node
      metric_relabel_configs:
        - action: drop
          regex: container_([a-z_[]+);
          source_labels:
            - __name__
            - image
        - action: drop
          regex: container_(network_tcp_usage_total|network_udp_usage_total|tasks_state|cpu_load_average_10s)
          source_labels:
            - __name__
      relabel_configs:
        - replacement: kubernetes.default.svc.cluster.local:443
          target_label: __address__
        - regex: (.+)
          replacement: /api/v1/nodes/${1}/proxy/metrics/cadvisor
          source_labels:
            - __meta_kubernetes_node_name
          target_label: __metrics_path__
      scheme: https
      tls_config:
          ca_file: /var/run/secrets/kubernetes.io/serviceaccount/ca.crt
          insecure_skip_verify: false
          server_name: kubernetes
    - job_name: integrations/kubernetes/kubelet
      bearer_token_file: /var/run/secrets/kubernetes.io/serviceaccount/token
      kubernetes_sd_configs:
        - role: node
      relabel_configs:
        - replacement: kubernetes.default.svc.cluster.local:443
          target_label: __address__
        - regex: (.+)
          replacement: /api/v1/nodes/${1}/proxy/metrics
          source_labels:
            - __meta_kubernetes_node_name
          target_label: __metrics_path__
      scheme: https
      tls_config:
          ca_file: /var/run/secrets/kubernetes.io/serviceaccount/ca.crt
          insecure_skip_verify: false
          server_name: kubernetes

integrations:
  prometheus_remote_write:
  - url: https://prometheus-blocks-prod-us-central1.grafana.net/api/prom/push
    basic_auth:
      username: <your Grafana Cloud user name>
      password: <your Grafana Cloud password>
As you can see, only cadvisor and kubelet metrics are currently scraped every minute (as advertised in the documentation).
Warning: I modified the scrape interval to avoid having too many active metric series to stay in the limits of the free tier.
Let’s see if we can improve that.
Modifying the agent configuration
I wanted to add the following metrics :
- Postgres metrics from the Postgres database deployed in my cluster.
- Gitea metrics exposed by the service / pod.
The Grafana Agent configuration file supports the following types of configuration
- integrations (like configured by default deployment): integrations are a combination of metrics scraping and a corresponding exporter.
- Prometheus-like configurations (if you are experienced with Prometheus or want to reuse some existing configurations)
- Loki configurations (for log scraping)
- Tempo configurations (for traces collection)
Remark: I found the info later on that integrations are ok to use as a start method to get up and running fast with Grafana Cloud but the best monitoring experience is still using the Prometheus approach.
Scraping Postgres metrics
Luckily enough, there is an integration available to collect metrics from a Postgres instance.
From an old article, I did already have a Postgres exporter deployed in my cluster. I decided to delete it to avoid any waste of resource.
helm uninstall prometheus-postgres-exporter -n postgresAfterwards, I modified the configuration of Grafana Agent configuration file (in the configmap) to add the postgres_exporter integration in the integrations: section.
postgres_exporter:
  enabled: true
  data_source_names:
  - postgresql://<username>:<password>@postgres-svc.postgres.svc.cluster.local:5432/?sslmode=disable
  # Disables collection of metrics from pg_settings. This will generate to much metrics.
  disable_settings_metrics: true
I have disabled the gathering of the Postgres settings because I don’t plan to use these metrics in any dashboards and don’t want to “waste” free metrics for these.
Apply the new configmap and restart the grafana-agent pod.
# Restart the Grafana Agent after configmap change
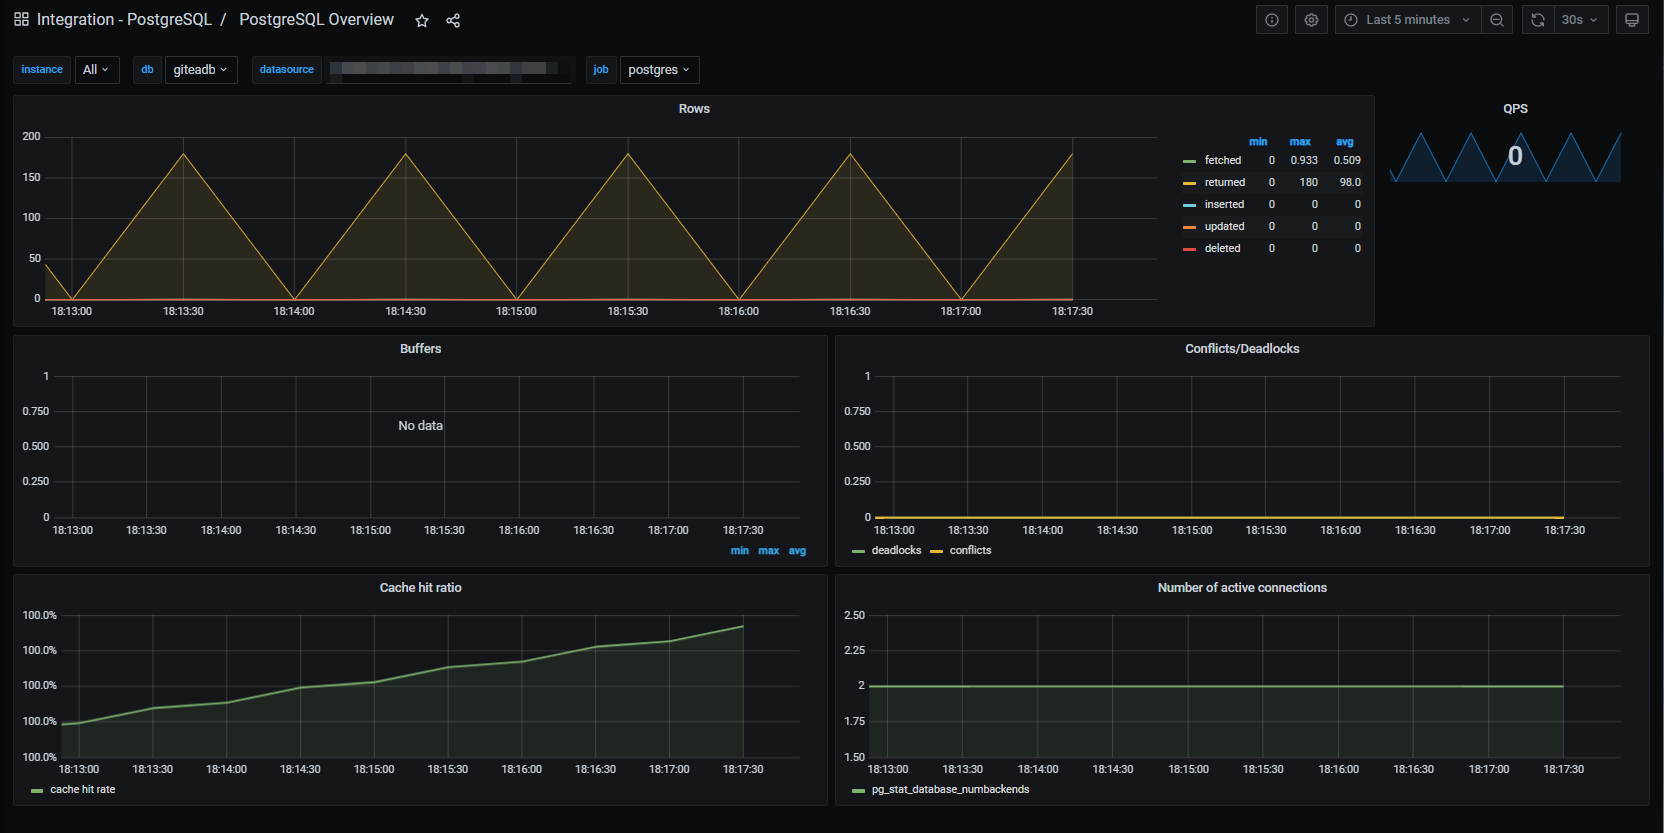
kubectl rollout restart deployment/grafana-agentAfter a few seconds, a new dashboard related to Postgres is available in Grafana Cloud and pg metrics are visible too.
Scraping Gitea metrics
This time, we will use a standard Prometheus configuration. In fact, we will enable a “standard” Kubernetes pod scraping configuration that is used in many other product deployments plus some tweaks to avoid metrics overload. This configuration will automatically scrape metrics from pods that satisfies the following conditions :
- the pod must have an annotation
prometheus.io/scrape=true. - the pod must have an annotation
grafana/cloud=true. - the pod must be running.
Add the following code in the prometheus -> configs section of the Grafana Agent configmap
prometheus:
  wal_directory: /tmp/grafana-agent-wal
  global:
    scrape_interval: 1m
    external_labels:
      cluster: <some cluster name>
  configs:
  - name: kubernetes-pods
    remote_write:
    - url: https://prometheus-blocks-prod-us-central1.grafana.net/api/prom/push
      basic_auth:
        username: <your Grafana Cloud user name>
        password: <your Grafana Cloud password>
    scrape_configs:
      job_name: prometheus/kubernetes/pods
      kubernetes_sd_configs:
        - role: pod
      relabel_configs:
        - action: keep
          regex: "true"
          source_labels:
            - __meta_kubernetes_pod_annotation_prometheus_io_scrape
        - action: replace
          regex: (https?)
          replacement: $1
          source_labels:
            - __meta_kubernetes_pod_annotation_prometheus_io_scheme
          target_label: __scheme__
        - action: replace
          regex: (.+)
          replacement: $1
          source_labels:
            - __meta_kubernetes_pod_annotation_prometheus_io_path
          target_label: __metrics_path__
        - action: replace
          regex: (.+?)(\:\d+)?;(\d+)
          replacement: $1:$3
          source_labels:
            - __address__
            - __meta_kubernetes_pod_annotation_prometheus_io_port
          target_label: __address__
        - action: keep
          regex: "true"
          source_labels:
            - __meta_kubernetes_pod_annotation_grafana_cloud
        - action: replace
          replacement: $1
          separator: /
          source_labels:
            - __meta_kubernetes_namespace
            - __meta_kubernetes_pod_label_name
          target_label: job
        - action: replace
          source_labels:
            - __meta_kubernetes_namespace
          target_label: namespace
        - action: replace
          source_labels:
            - __meta_kubernetes_pod_name
          target_label: pod
        - action: replace
          source_labels:
            - __meta_kubernetes_pod_container_name
          target_label: container
        - action: replace
          separator: ':'
          source_labels:
            - __meta_kubernetes_pod_name
            - __meta_kubernetes_pod_container_name
            - __meta_kubernetes_pod_container_port_name
          target_label: instance
        - action: labelmap
          regex: __meta_kubernetes_pod_annotation_prometheus_io_param_(.+)
          replacement: __param_$1
        - action: drop
          regex: Succeeded|Failed
          source_labels:
            - __meta_kubernetes_pod_phase
Restart the grafana-agent deployment
kubectl rollout restart deployment/grafana-agentCheck that the Grafana Agent is restarting successfully.
As Gitea is deployed using Helm chart, modify the file gitea-values.yaml to add the required annotations for scraping.
gitea:
  podAnnotations:
    prometheus.io/scrape: "true"
    prometheus.io/port: "3000"
    grafana/cloud: "true"
Remark: I did combine this with an update of the version of Gitea.
# Update Helm repositories
helm repo update

# Upgrade the Gitea installation
helm upgrade --install -f gitea-values.yaml gitea gitea-charts/gitea -n gitea
The metrics should come into your Grafana Cloud Prometheus instance soon.

I can now build my own Gitea dashboard (or import an existing one).
Troubleshooting the Grafana Agent
Not everything will run fine at the first try and you’ll certainly have times when you’ll want to have a look at what the agent is doing. Additionally to the docuementation, you should be aware of the Grafana Agent API.
The APIs I found the most usefull are
GET /agent/api/v1/instancesand
GET /agent/api/v1/targetsThis one is particularly interesting when you want to understand what the agent is scraping and which labels are processed.
To run those API calls, simply configure a port-forward to the Grafana Agent pod on port 12345 and run curl from your workstation. Pipe the result through jq to receive a nicely formatted response.
curl GET http://localhost:12345/agent/api/v1/targets | jqBilling and charging monitoring
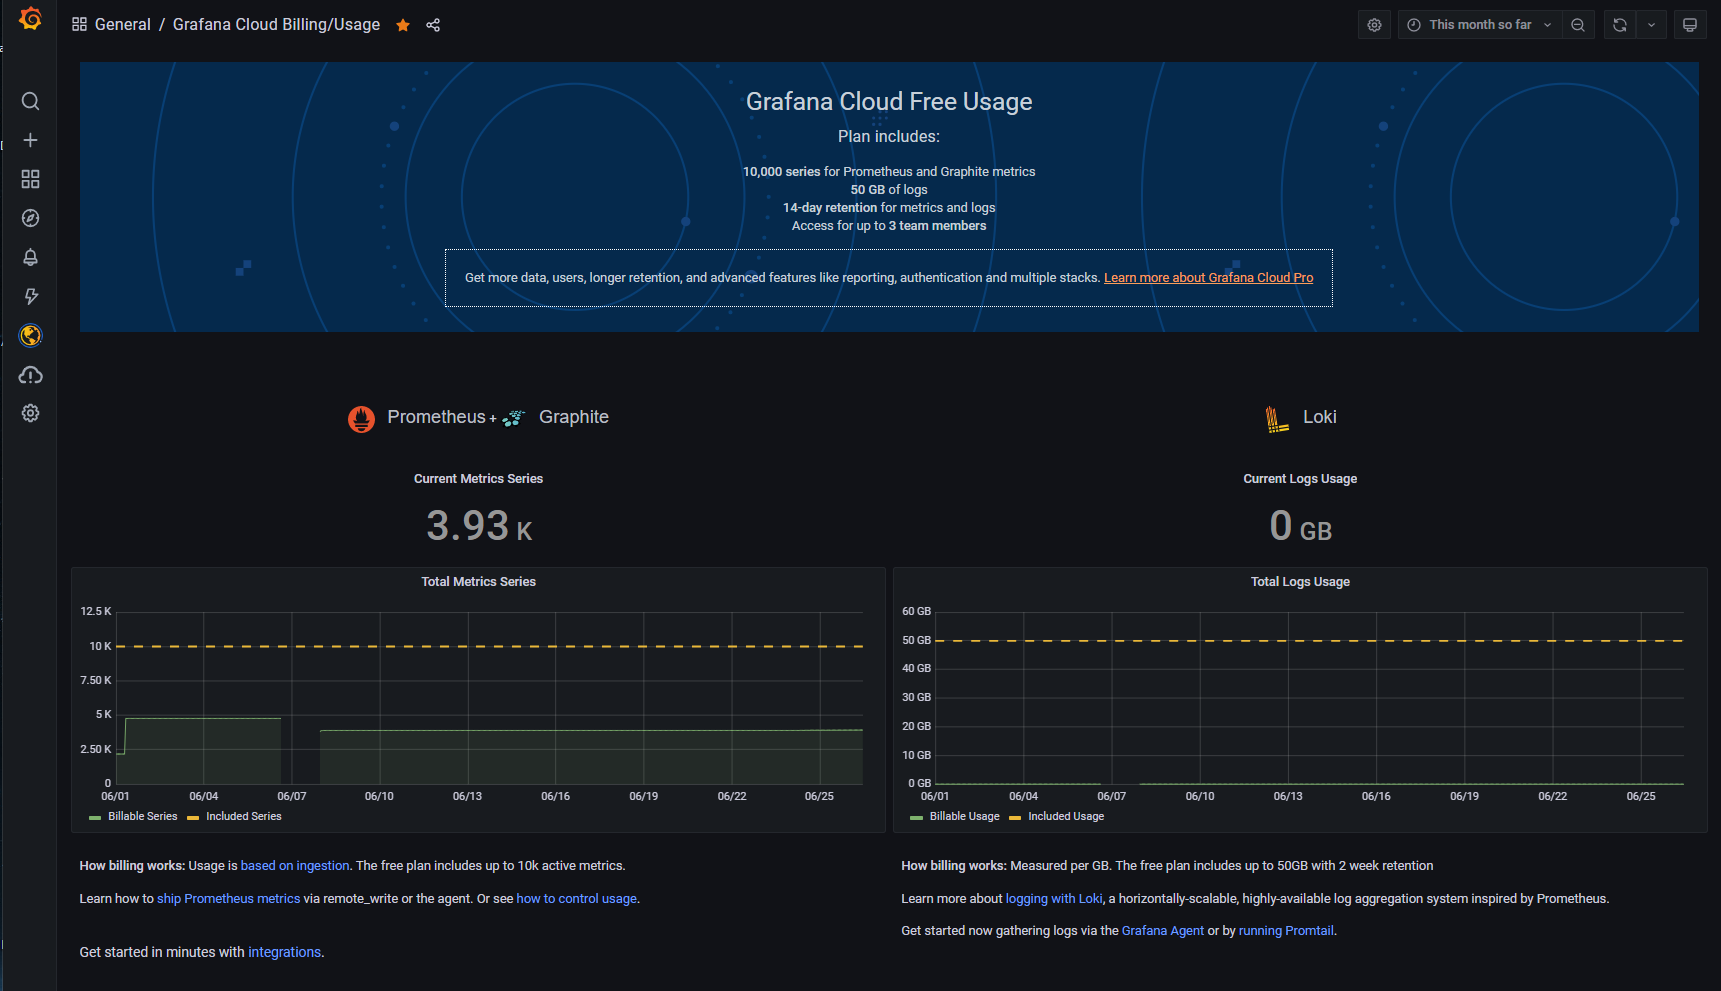
As I’m planning to enjoy the free tier of the service, it’s important to have a look at the current usage / consumption of the resource available for that tier. This is possible when looking at the corresponding dashboard that is automatically deployed within your Grafana Cloud instance.
Go to Dashboards -> Manage. Type billing in the search bar and click on the Grafana Cloud Billing/Usage dashboard.
Conclusion
This is the end of the first part of monitoring your Scaleway Kapsule cluster with Grafana Cloud.
Next time we’ll see how to get logs from some containers and store them in Grafana Cloud’s Loki store.