This is a follow up post to my article on how to setup Grafana Cloud monitoring for your Scaleway Kapsule Kubernetes cluster. I will set up some basic alerting based on metrics and configure Slack notifications.
Grafana Cloud alerts
There are 2 types of alerts available in Grafana Cloud :
-
Grafana alerts: these alerts are the ones you can also use when running Grafana on-premises. They are create from a graph panel within a dashboard.
-
Grafana Cloud alerts: these alerts are an implementation of Prometheus-style rules that you can use to query your metrics and trigger Prometheus-Alertmanager-style alerts. Grafana Cloud alerts are not only based on metrics but also on logs using Loki as datasource.
In this post, I will create Grafana Cloud alerts.
Define an alert
Pre-requisite: read the Grafana Cloud documentation on alerting.
I shall create a simple alert based on the Kubelet dashboard of the Grafana Cloud Kubernetes Integration.
Login to your Grafana Cloud instance and select the Kubelet dashboard.
In this dashboard, you’ll find a panel with the number of kubelet that are up.
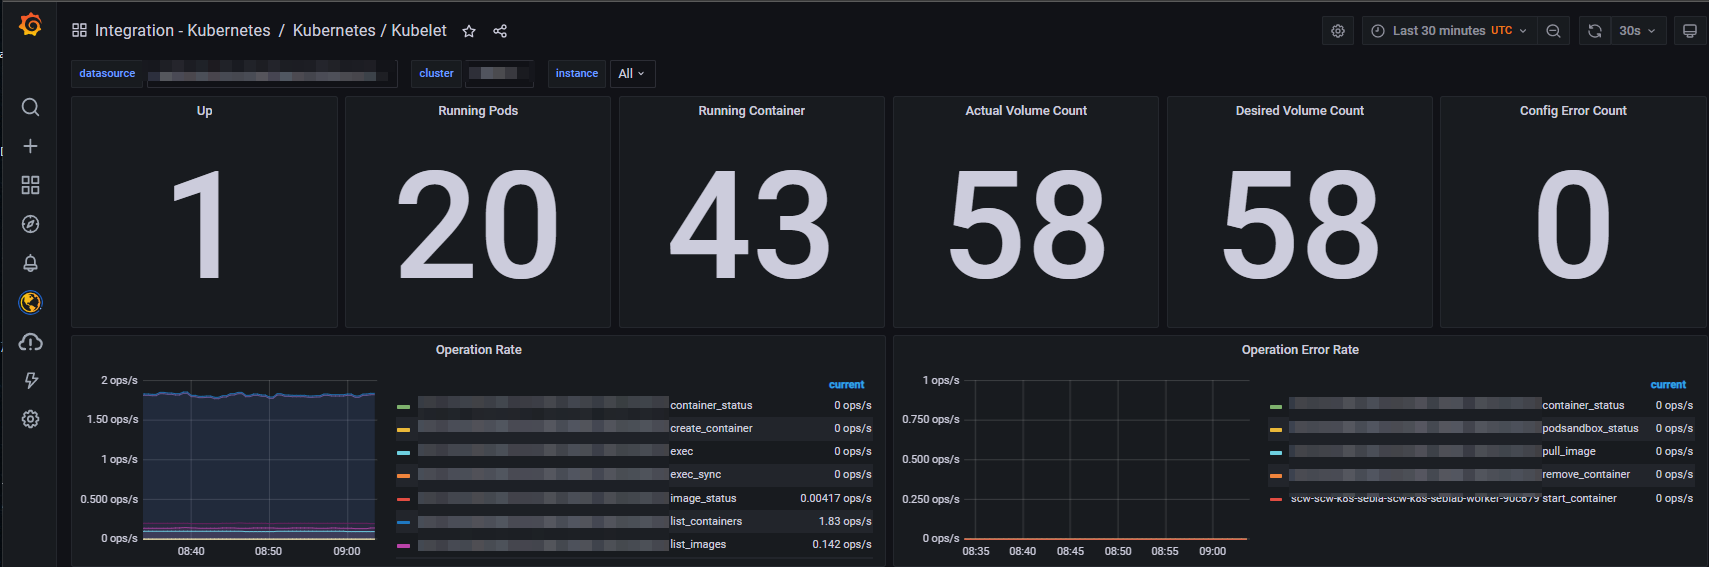
Reminder:
kubeletis an agent that runs on each worker node. By monitoring the number ofkubeletsthat are up, I also monitor the number ofnodesthat are available to schedule workloads.
In the side panel on the left of your Grafana Cloud interface, select Grafana Cloud Alerting -> Rules.
Select the Prometheus datasource.
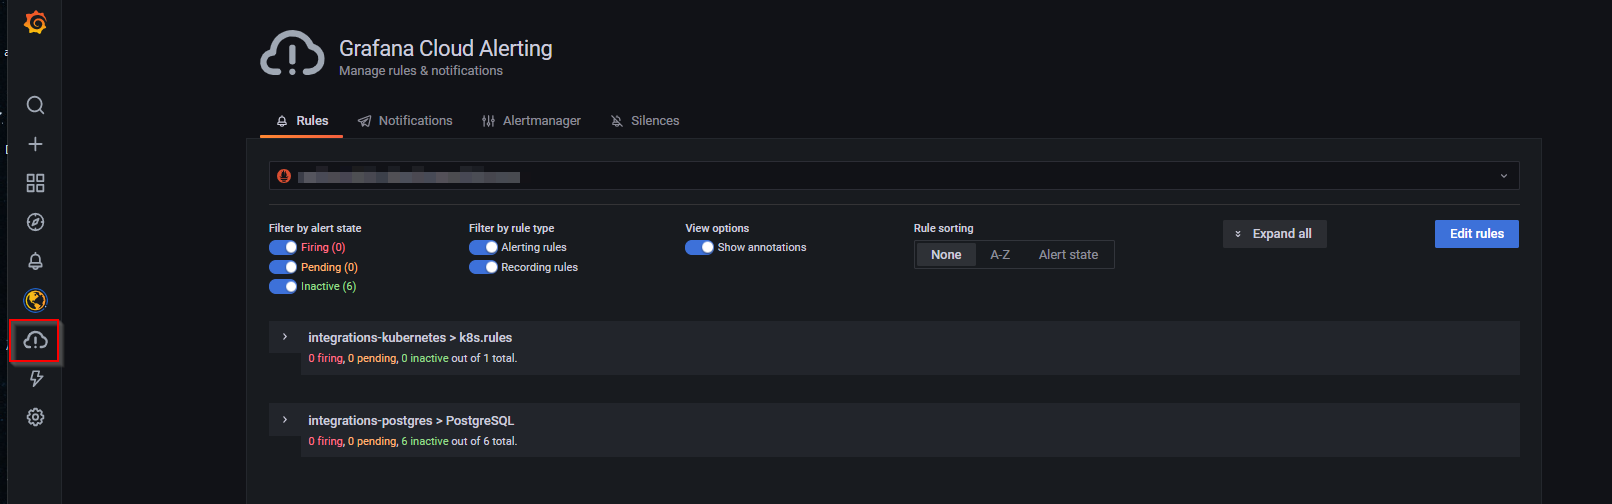
There are already some rules defined by the integrations I have deployed. Let’s add an alert rule by selecting Edit rules -> + Add rule in the integrations-kubernetes > k8s.rules rule group.
Note: there are limits for both number of
rule groups(20) and number ofrulesperrule group(15). Lifting up these limits is possible but requires a pro subscription.
alert: KubeletDown
expr: sum(up{cluster="<your cluster name>", job="integrations/kubernetes/kubelet"}) < 1
for: 1m
labels:
  severity: critical
annotations:
  description: Number of available kubelet is < 1.
  summary: Nodes available
Configure Slack
Go to a Slack workspace you own and select Settings and Administration -> Manage Apps.
Add Incoming Webhook and get the webhook URL : https://hooks.slack.com/services/…
Configure the app to be able to post messages in a specific channel (I chose #monitoring … how imaginative is it hey …)
You can also customize the icon of the integration (I use Grafana icon).
Add Slack webhook to Grafana Cloud AlertManager configuration
In Grafana Cloud, select Grafana Cloud Alerting -> AlertManager -> Edit configuration
Modify the route: receiver: and add Slack configuration
global:
  resolve_timeout: 5m
  http_config:
    follow_redirects: true
  slack_api_url: https://hooks.slack.com/services/...
route:
  receiver: slack-notification
  continue: false
receivers:
  - name: slack-notification
    slack_configs:
      - channel: "#monitoring"
        send_resolved: true
templates: []
Save the changes.
Test
To test the setup, I modified the alert rule expr: by sum(up{cluster="<your cluster name>",job="integrations/kubernetes/kubelet"}) <= 1
After a few second, the alerts was in pending state

And after a minute, I received the Slack notification

This is of course a minimalistic alert message. You can customize it to display more usefull information with the help of AlertManager Slack Playground tool.
global:
  resolve_timeout: 5m
  http_config:
    follow_redirects: true
  slack_api_url: https://hooks.slack.com/services/...
route:
  receiver: slack-notification
  continue: false
receivers:
  - name: slack-notification
    slack_configs:
      - channel: "#monitoring"
        send_resolved: true
        text: "{{ range .Alerts }}{{ .Annotations.description }}\n{{ end }}"
templates:
Conclusion
This setup is the foundation to enable more alerts to be triggered and get me notified through a Slack channel in my own workspace. In the near future, I’ll put more attention to study how AlertManager is working to better structure the rules and come with more alerts (like storage left on physical volumes).
This concludes part 2 of my Grafana Cloud serie. Part 3 (probably the last one) will be about sending logs of Kubernetes workload to Grafana Cloud Loki. Stay tuned.