Greetings, this is the third and last article describing how to monitor your Kubernetes cluster with Grafana Cloud free tier.
In part one, I described how to setup a free tier Grafana Cloud account and how to install Grafana Agent to collect and store metrics.
In part two, I did configure alerts and notifications to a Slack channel.
This last post describes how to collect logs from containers running in your cluster and store them in the Loki instance included in your Grafana Cloud free tier account. Remember you have 50 GB of logs available for free. After that, you’ll pay for each additional data stored.
Grafana Agent or Promtail?
The collection of logs for Loki normally happens through Promtail agent. The Grafana Agent also provides this capability. Unfortunately, the Grafana Agent for metrics that is setup with Kubernetes integration is controlled through a Kubernetes deployment object. To be able to scrape logs, the agent must be deployed as a daemonset. You have then to deploy a second agent specifically for logs. I decided to stick with the agent but this is definitely something to be improved / clarified for the future by Grafana Labs.
Some insights about this situation can be found in that post on Grafana Cloud community forum.
Create Grafana Cloud API key
Login to your Grafana Cloud account to the Grafana Cloud portal. Select the organization for which you want to create a new API key. If you’re using a free tier account, you should only have one available.
Select API keys from the SECURITY section on the left then click +Add API key.
Give a meaningful name and assign the role MetricsPublisher.
Copy the value of the API key (it is only displayed once at creation) and store it safely in a password manager.
Close.
Configure LOKI datasource
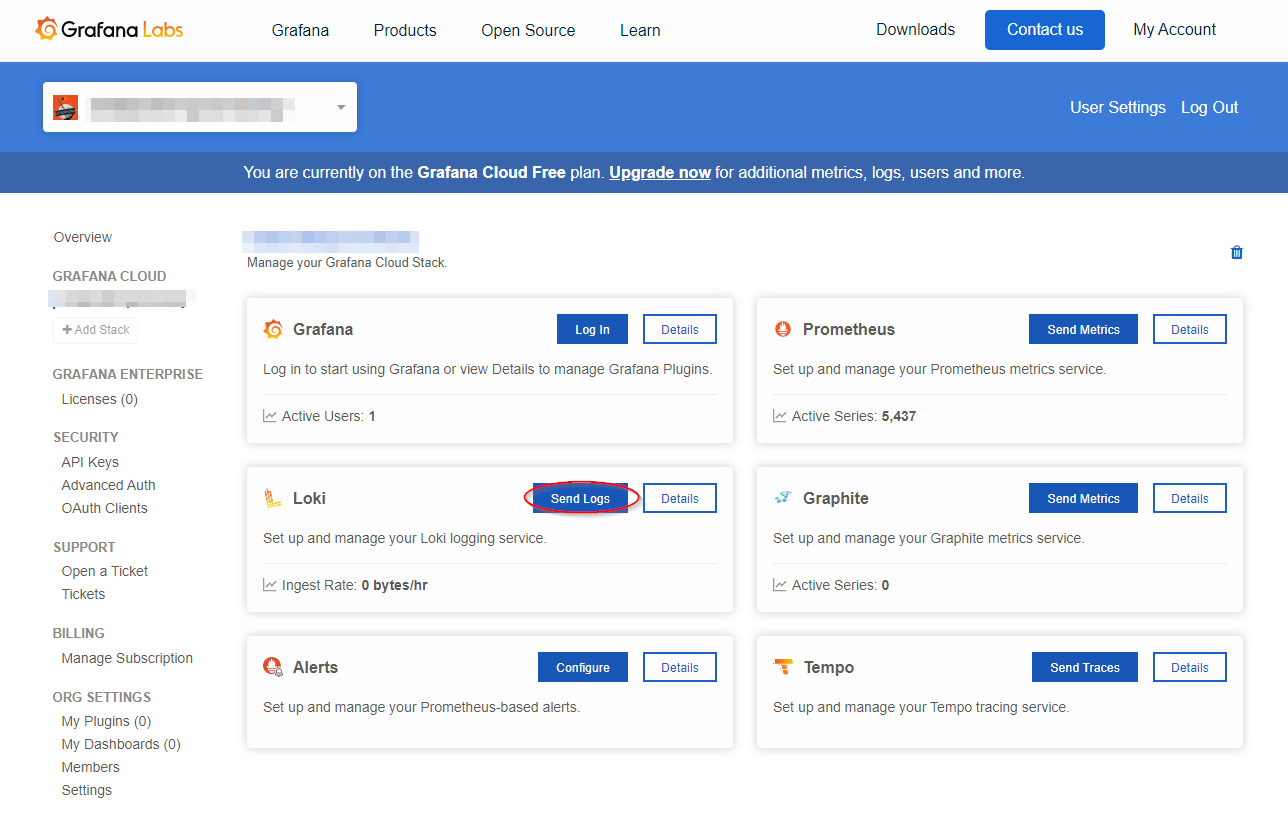
Still in the Grafana Cloud portal, go back to the home page and click Send Logs button in the Loki tile.
Keep the page open and log in to your Grafana Cloud instance in another tab of your browser.
Apply the instructions to add the Loki datasource.
PS: I did not have to do this because the setup done in the first article took care of it.
Deploy and configure new Grafana Agent for logs
Get the sample agent-loki.yaml Kubernetes manifest from Grafana Agent Github repository.
Replace all occurrences of YOUR_NAMESPACE by the name of the namespace where you want to deploy the daemonset.
Apply the manifest by running kubectl apply -f agent-loki.yaml.
Now, as this manifest does not contain a configmap object with the configuration of the agent, the container will not start.
Create a configmap by using (and tweaking if needed) the sample configmap available in Grafana Agent documentation.
Tip: you can find some good explanations about what the scrape configs do in the jsonnet templates inside the
tankafolder of the Grafana Agent Github repository. For log scraping configs, have a look at this file.
The standard configmap is pretty extensive as it scrapes the logs of the pods that fulfill one of the following requirements :
- the pod has a
namelabel. - the pod has a
applabel. - the pod has a direct controller like
StatefulSets. - the pod has an indirect controller like
Deploymentsthat createReplicaSetsthat create pods. - the pod is part of the static control-plane pods.
Using this scraping configuration could be risky if you wish to stay in the limits of the free tier (max 50 GB of log data). I personnaly use a restricted version of it by only scraping pods that have a label app.kubernetes.io/name and an annotation logging=true.
apiVersion: v1
data:
  agent.yaml: |
    loki:
        configs:
          - clients:
              - url: <LOKI_ENDPOINT>
                basic_auth:
                  username: <USERNAME>
                  password: <API KEY>
            name: default
            scrape_configs:
              - job_name: kubernetes-pods-logging
                kubernetes_sd_configs:
                  - role: pod
                pipeline_stages:
                  - docker: {}
                relabel_configs:
                  - source_labels:
                      - __meta_kubernetes_pod_label_app_kubernetes_io_name
                    target_label: __service__
                  - source_labels:
                      - __meta_kubernetes_pod_node_name
                    target_label: __host__
                  - action: drop
                    regex: ""
                    source_labels:
                      - __service__
                  - action: keep
                    regex: "true"
                    source_labels:
                      - __meta_kubernetes_pod_annotation_logging
                  - action: labelmap
                    regex: __meta_kubernetes_pod_label_(.+)
                  - action: replace
                    replacement: $1
                    separator: /
                    source_labels:
                      - __meta_kubernetes_namespace
                      - __service__
                    target_label: job
                  - action: replace
                    source_labels:
                      - __meta_kubernetes_namespace
                    target_label: namespace
                  - action: replace
                    source_labels:
                      - __meta_kubernetes_pod_name
                    target_label: pod
                  - action: replace
                    source_labels:
                      - __meta_kubernetes_pod_container_name
                    target_label: container
                  - replacement: /var/log/pods/*$1/*.log
                    separator: /
                    source_labels:
                      - __meta_kubernetes_pod_uid
                      - __meta_kubernetes_pod_container_name
                    target_label: __path__
        positions_directory: /tmp/positions
    server:
        http_listen_port: 8080
        log_level: info
kind: ConfigMap
metadata:
  name: grafana-agent-logs
  namespace: default
Apply the configmap and restart the daemonset grafana-agent-logs
# Apply configmap
kubectl apply -f agent-loki-configmap.yaml

# Restart grafana-agent-logs daemonset
kubectl rollout restart ds/grafana-agent-logs
Configure a pod for logging
Check which pods in your cluster do already have the label app.kubernetes.io/name.
kubectl get pods -A -l app.kubernetes.io/name
NAMESPACE      NAME                                       READY   STATUS    RESTARTS   AGE
blog           seblab-blog-deployment-848b7dd499-jddjl    1/1     Running   0          45h
gitea          gitea-0                                    1/1     Running   0          25d
kube-system    nginx-ingress-hb4n4                        1/1     Running   1          246d
Select nginx-ingress (it generates quite some logs) and add the annotation logging=true.
kubectl annotate pods nginx-ingress-hb4n4 logging=trueCheck if grafana-agent-log pod hosted on the same node as the nginx-ingress pod starts to scrape the logs of nginx-ingress
# Check logs of the agent to see if the configuration is working
kubectl logs ds/grafana-agent-logs
ts=2021-08-30T06:33:57.279112071Z level=info msg="server configuration changed, restarting server"
ts=2021-08-30T06:33:57.279893392Z level=info caller=server.go:245 http=[::]:8080 grpc=[::]:9095 msg="server listening on addresses"
ts=2021-08-30T06:35:37.276091151Z level=info component=loki component=loki loki_config=default msg="Adding target" key="{app_kubernetes_io_name=\"ingress-nginx\", app_kubernetes_io_part_of=\"ingress-nginx\", container=\"nginx-ingress-controller\", controller_revision_hash=\"5b97cd775d\", job=\"kube-system/ingress-nginx\", logging=\"true\", namespace=\"kube-system\", pod=\"nginx-ingress-hb4n4\", pod_template_generation=\"1\"}"
Visualize logs in Grafana Cloud
The last step is to check if the logs are visible from Grafana UI. Login to your Grafana Cloud instance and choose Explore.
Select the Loki datasource and enter the following query:
{app.kubernetes.io/name="ingress-nginx"}
If everything is fine, you should receive some logs in Grafana.

Conclusion
This post concludes the serie dedicated to the setup of Grafana Cloud free tier to monitor the metrics and logs of a Kubernetes cluster (here a cluster hosted at Scaleway).
I like the services provided by Grafana Cloud. It’s still maturating as we have seen with the Grafana Agent deployment patterns and the integrations are nice idea to onboard quickly the enthousiasts that do not want to dive into the intricacies of Prometheus relabeling. It also enables you to not deploy a full monitoring stack inside your cluster and use its compute power to run your applications only. I suppose it all depends on the level of enthousiasm you want to dedicate to the management of your cluster.
Take care and see you soon.